Figures & data
Figure 1 Chemical structure of Amoxicillin.
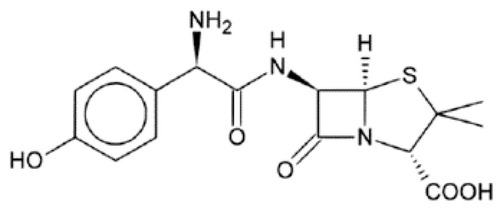
Table 1 Composition and Physical Character of AMX-MTs Formulation, Each Dose of Tablets Contain 250 Mg of AMX
Table 2 Formulation Code, Drug:Lipid Ratio and Chitosan (CN) Solution Concentration (mg/mL), PI, ZP %EE and % DL of AMX-LPN Formulations
Figure 2 TEM image of optimized AMX-LPNs formula.
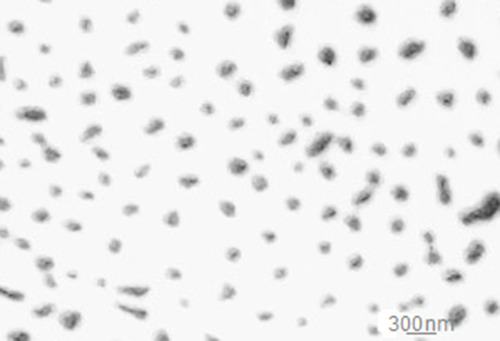
Figure 3 DSC thermograms of AMX, AMX-LPN1, AMX-LPN4, AMX-LPN7, and AMX-LPN10.
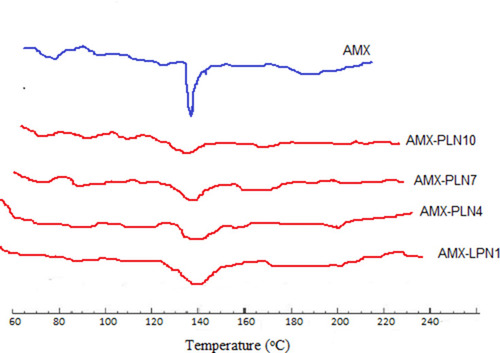
Figure 4 FTIR spectra of AMX, AMX-LPN1, AMX-LPN4, AMX-LPN7, and AMX-LPN10.
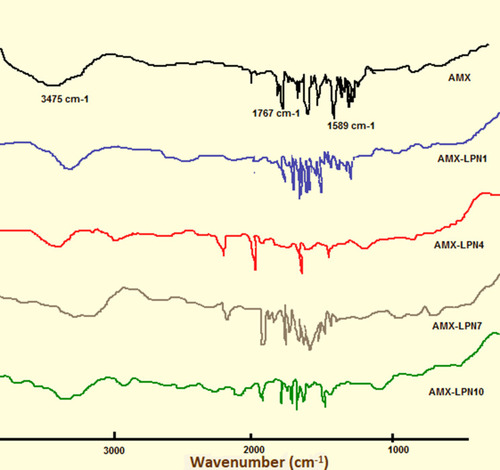
Figure 5 (A, B) In vitro dissolution profiles of AMX from Mini-tablets formulations (A) for MT1-MT-6, (B) for MT-7-MT-12 in 0.1N HCl. Each point is a mean value of three tablets.
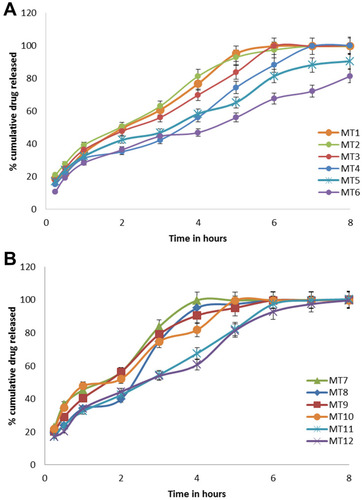
Figure 6 (A-D). In vitro dissolution profiles of AMX from LPNs formulations for (A) LPN1-3, (B) LPN4-6, (C) LPN7-9, (D) LPN10-12 in 0.1N HCl. Each point is a mean value of three trials.
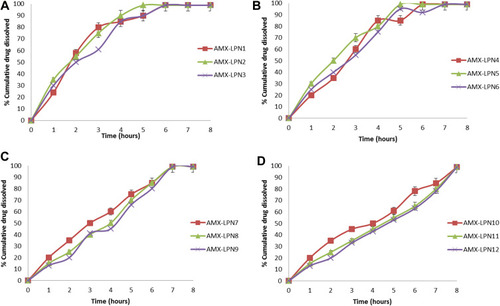
Table 3 Study of in vitro Release Kinetics Data for AMX from Selected Mini-Tablets and Lipid/Polymer Nanolipid Systems
Table 4 %EE, PS, ZP of AMX-LPN11 Under Different Storage Conditions for 45 Days
Table 5 Mean Results ±SD for Microbiological Tests of Selected AMX-PLN Formula
Table 6 Pharmacokinetic Parameters of AMX After Oral Administration of AMX-LPN11 and Commercial Tablets in Rats
Figure 7 AMX plasma concentration (mean ± SE) time profiles in rats after oral administrations MT6, AMX-LPN11, and commercial tablets.
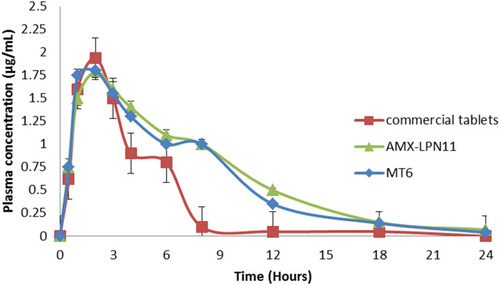
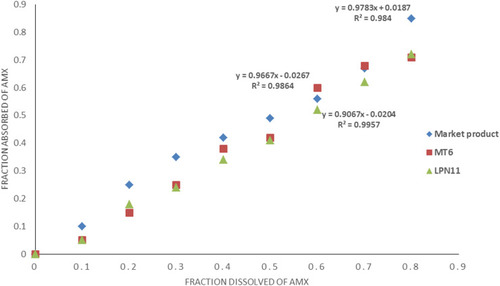
Figure 8 In vitro/in vivo correlation between drug released in 0.1 N HCl (pH1.2) and plasma drug concentration in rats using MT6, LPN11, and market tablet.