Figures & data
Table 1 Timeline of Events in the Development of Lonapegsomatropin
Figure 1 Timeline of daily GH and long-acting GH product availability.
Notes: The timeline shows the year each GH product became available. *GH-gelatin was never approved for use.
Abbreviations: Pit-hGH, pituitary human growth hormone; GH, growth hormone; rhGH, recombinant human growth hormone; PGHD, pediatric growth hormone deficiency; AGHD, adult growth hormone deficiency; USA, United States of America; LAGH, long-acting growth hormone; EU, European Union.
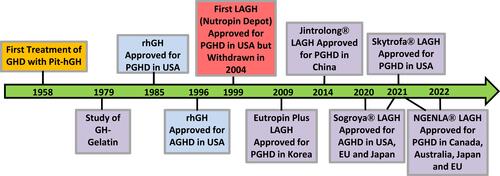
Figure 2 Schematic overview of lonapegsomatropin.Citation24
Notes: Lonapegsomatropin is a sustained-release inactive prodrug consisting of unmodified GH transiently bound to an inert carrier via a proprietary linker. The linker undergoes predictable autohydrolysis under physiologic pH and temperature, releasing fully active GH at the GH receptor. The inert carrier is primarily cleared by renal excretion. Adapted from Thornton PS, Maniatis AK, Aghajanova E, et al. Weekly lonapegsomatropin in treatment-naive children with growth hormone deficiency: the Phase 3 heiGHt trial. J Clin Endocrinol Metab. 2021;106(11):3184–3195. Copyright © The Author(s) 2021. Published by Oxford University Press on behalf of the Endocrine Society.This is an Open Access article distributed under the terms of the Creative Commons Attribution-NonCommercial-NoDerivs licence (https://creativecommons.org/licenses/by-nc-nd/4.0/).24
Abbreviations: GH, growth hormone; hGH, human growth hormone; TransCon, transiently conjugated.
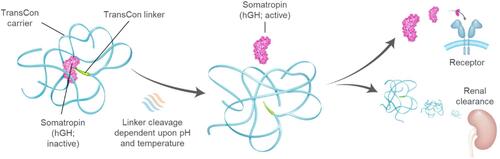
Table 2 Comparison of Growth Responses Between Long-Acting and Daily Growth Hormones in Pediatric Growth Hormone Deficiency.Citation16,Citation24,Citation29
Table 3 The Predicted Difference Between Observed IGF-I SDS and Average IGF-I SDS and Predicted Ratio Between IGF-I and Average IGF-I Concentrations by timeCitation25
Table 4 Recommended Dosing for Patients Prescribed Doses of 0.24 mg/kg/Week Based Upon Available Cartridge sizeCitation39
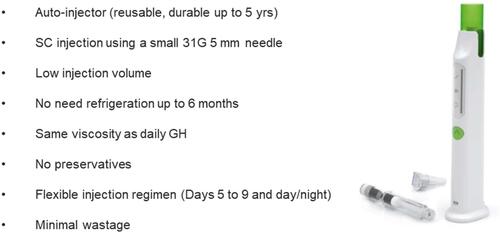
Figure 3 Skytrofa electronic delivery device and its features.Citation39
Note: Reproduced with permission from Ascendis. SKYTROFA™ (lonapegsomatropin-tcgd) for injection, for subcutaneous use; 2021. Available from: https://www.accessdata.fda.gov/drugsatfda_docs/label/2021/761177lbl.pdf. © 2022 Ascendis Pharma. All rights reserved. SKYTROFA™, Ascendis®, TransCon®, the Ascendis Pharma logo and the company logo are trademarks owned by the Ascendis Pharma Group.Citation39
Abbreviations: GH, growth hormone; mm, millimeter; SC, subcutaneous.