Figures & data
Figure 1 The overall scheme of the research processes.
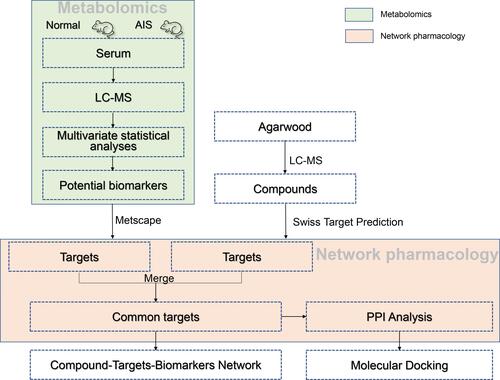
Figure 2 (A) Score scatter plot of PLS-DA model for control (green) and AIS (blue) groups. (B) A 100 permutations test of PLS-DA model (R2=0.847; Q2=−0.133). (C) Volcano plot, and (D) S-plot.
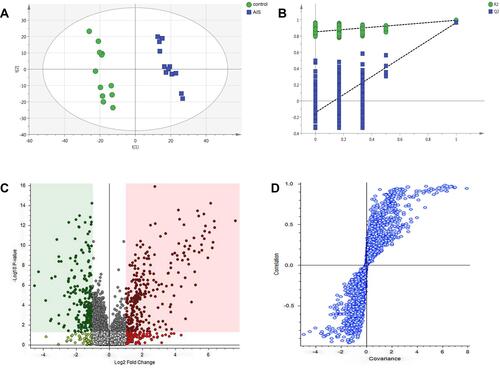
Figure 3 (A) Heat map of the 18 differentially biomarkers between the control and AIS group. (B) Pathway impact analysis with MetaboAnalyst: 1 Tryptophan metabolism; 2 Arginine and proline metabolism; 3 Cysteine and methionine metabolism; 4 Steroid hormone biosynthesis. (C) Schematic diagram of the tryptophan metabolic pathway.
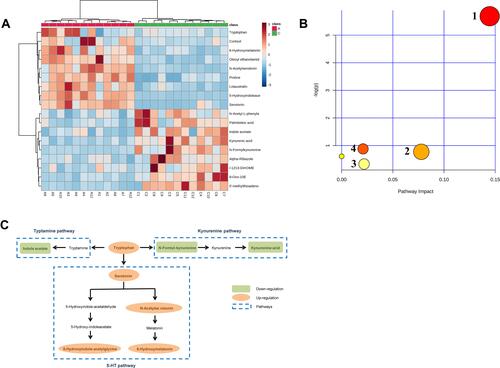
Figure 4 The MS/MS spectra and the proposed fragmentation routes of representative compounds. (A) tetrahydro-2-(2-phenylethyl) chromones, (B) flidersia-2-(2-phenylethyl) chromones, (C) phenolic, and (D) sesquiterpene.
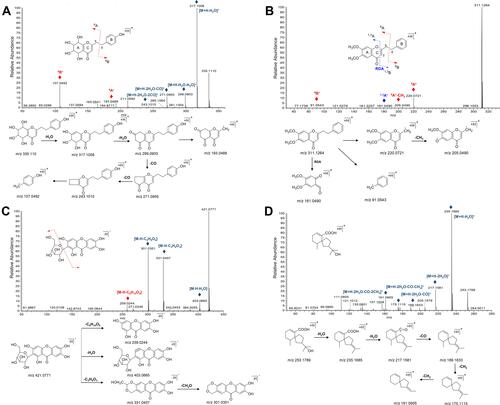
Figure 5 PPI network for AIS. (A) General view of the interactions of proteins and clustered proteins. (B) MCODE networks divided by functions.
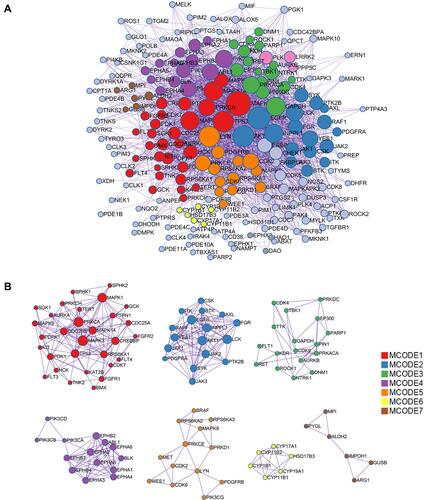
Figure 6 The C-T-B network of agarwood. The number of the compounds is consistent with that in Table S3.
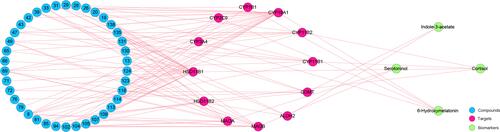
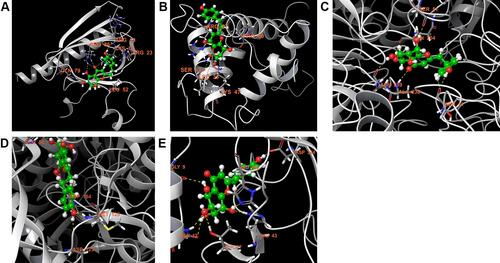
Figure 7 Stereoview of substrate/inhibitor binding of aquilarone F and (A) AKT1, (B) TP53, (C) GAPDH, (D) MAPK3, and (E) EGFR.