
Figures & data
Figure 1 The workflow of the study.
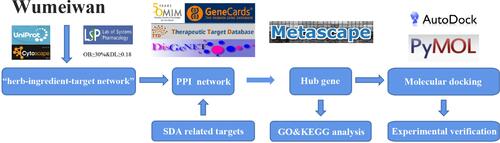
Figure 2 Schematic diagram of OVA-induced plus descending DEX intervention chronic asthmatic model. Sensitization: the mixture of OVA and aluminum hydroxide was intraperitoneally injected into rats at day 1 and 8. Challenge: from day 15, rats were challenged with 1% OVA nebulization inhalant solution every two days for 30 minutes, and it would last for seven weeks. Therapeutic interventions: DEX was intraperitoneally injected into rats with the dosage of 0.5mg/kg in day 15 to day 28, and it was withdrawn at the rate of 0.1mg/kg per week from day 29 to the end of the challenge.
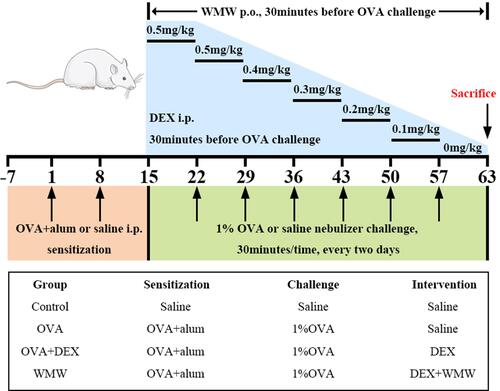
Figure 3 The “herb-ingredient-target” network. The inverted triangle, octagon, and diamond corresponded to the herb, ingredient, and target respectively. The closer the nodes were connected, the larger the area of the node was.
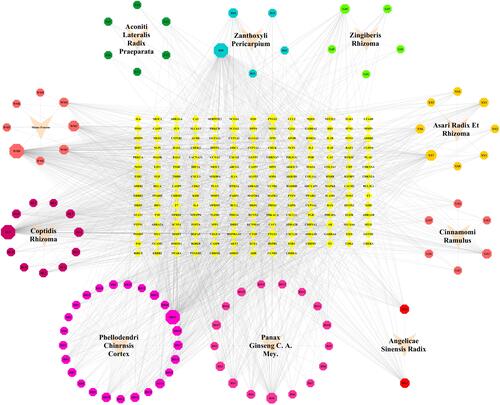
Figure 4 Venn diagram of common targets.
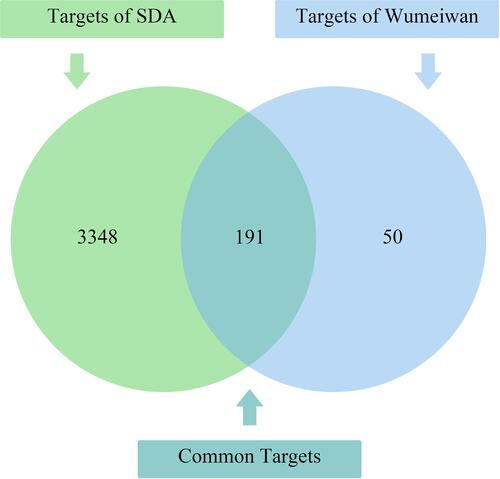
Table 1 DC, BC, CC, and Stress Information of HUB Genes
Figure 5 Screening of HUB genes. (A) PPI network of WMW against SDA performed by STRING database with the parameters of the organism for “Homo sapiens” and the minimum required interaction score≥ 0.9. (B) 35 HUB genes network performed by Cytoscape yFiles Radial Layout. Low degree values showed large sizes and bright colors, and small sizes and dark colors for high degree values on the contrary. (C) The 10 core targets network, including JUN, MAPK1, IL6, TP53, RELA, HSP90AA1, EGFR, AKT1, CXCL8, and TNF.
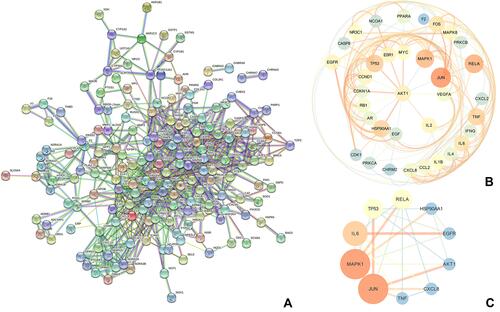
Figure 6 GO function of HUB genes. The horizontal axis represented the counts of genes in the enriched terms, and the vertical axis represented the specific terms of BPs, CCs, and MFs.
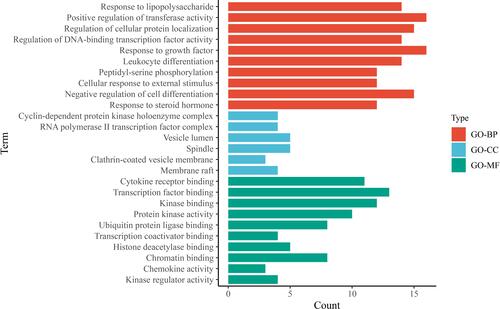
Figure 7 KEGG pathway analysis. Bubble plot performed the top 20 signaling pathways of WMW against SDA. The horizontal axis represented the enrichment scores of pathways, and the vertical axis represented the names of pathways. The counts of genes in each enriched pathway were presented via the bubble, and the P-value was marked by the bubble color.
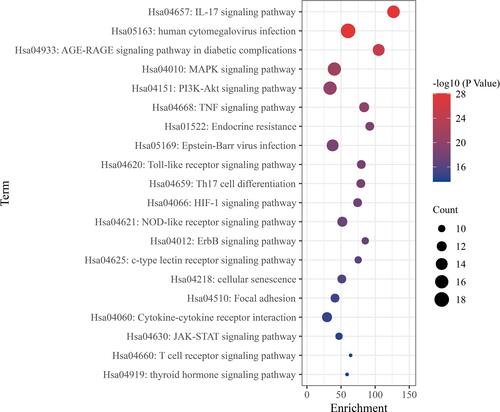
Table 2 Molecular Docking Results
Figure 8 Molecular docking between CXCL8 and five pivotal ingredients, including quercetin (A), beta-sitosterol (B), kaempferol (C), palmidin A (D), and candletoxin A (E).
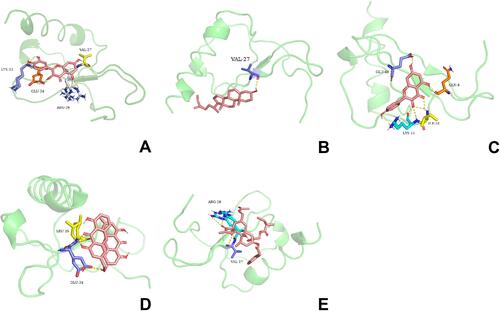
Figure 9 Correlation heatmap of docking results between the 10 core targets and five pivotal ingredients. The binding energy was marked by different colors, red for higher scores and green for lower scores. It could be observed that all core targets could stably bind with five pivotal ingredients, especially CXCL8 showed the lowest energy.
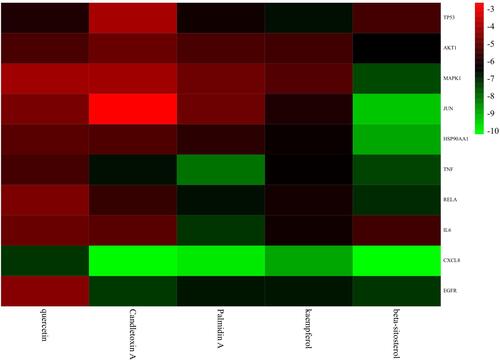
Figure 10 Effects of WMW on pathological features of OVA-induced plus descending DEX intervention chronic asthmatic model. WMW treatment could reduce the airway inflammations ((A) H&E staining, magnification×400, (D) inflammation scores), airway remodeling ((B) Masson staining, magnification×400, (E) calculations of collagen volume fraction), and the expression of IL-8 ((C) IHC staining, magnification×400, (F) IL-8 average optical density of IHC staining images, (G) Relative expressions of IL-8 performed by real-time PCR) in model rats. All results were expressed as Mean ± SEM. Compared with the control group, *P<0.05, **P<0.01, ***P<0.001.
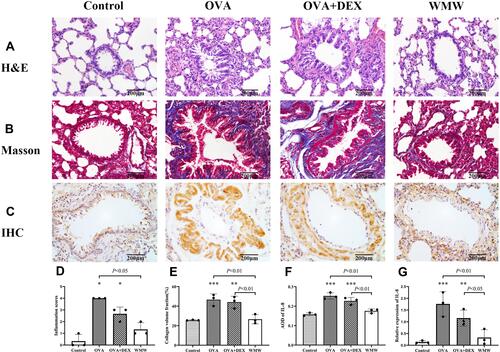
Table 3 Relative Expression of IL-8 in All Groups