Figures & data
Figure 1 Antithrombotic experiment design. (A) Experimental process in rabbit model of arteriovenous bypass thrombosis. (B) Experimental process in rat model of thrombotic cerebral infarction.
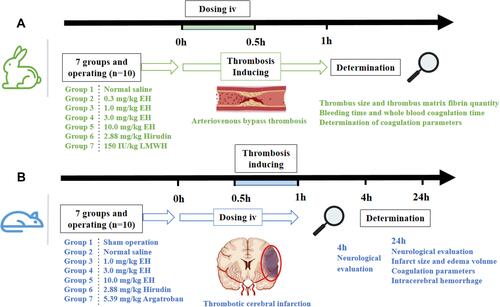
Table 1 Neurological Evaluation Criterion After Middle Cerebral Artery Occlusion (MCAO) in Rats
Figure 2 The tail bleeding time in healthy Kunming mice. Twenty minutes after injection with EH or hirudin through caudal vein, 6 mm of tail tip was cut off and the tail was immediately put into normal saline to record the bleeding time. **P < 0.01, in comparison with normal saline.
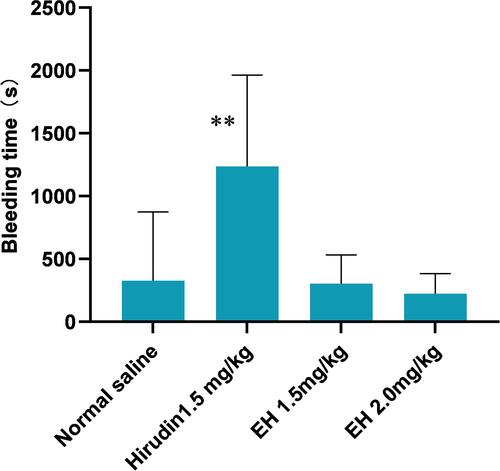
Figure 3 Effect of EH on thrombosis and bleeding in rabbit model of arteriovenous bypass thrombosis. At the beginning of arteriovenous bypass thrombus induction in rabbit, EH was intravenously infused for 30 minutes. Sixty minutes after induction, the thrombus was removed for analysis and the side-effect of bleeding was evaluated. (A) Effect of EH on the wet and dry weight of thrombus. The wet weight of thrombus was record first and cut two parts and one part was baked in oven at 50°C for three days to calculate the dry weight of thrombus. (B) Effect of EH on the quantity of thrombus matrix fibrin. The other part of thrombus was used to detect the amount of fibrin by digestion with 1% NaOH. (C) Effect of EH on auricular bleeding time and coagulation time of whole blood. After a fixed length wound (avoiding large blood vessels) was cut at the ear edge of the rabbit the bleeding time was recorded, and a drop of whole blood was taken in a glass dish to record the coagulation time by needle picking. *P < 0.05, **P < 0.01, ***P < 0.001, in comparison with normal saline; +P < 0.05, in comparison with equimolar hirudin.
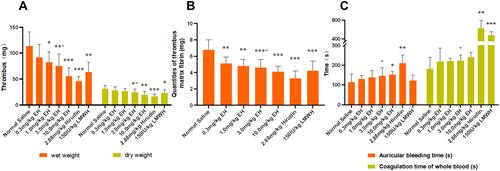
Table 2 Effect of EH on Coagulation Parameters in Rabbits
Figure 4 The effect of EH on neurological impairment scores at 4 h and 24 h after operation in rat with cerebral infarction. Thirty minutes after drug administration, the cerebral infarction in rats was induced with FeCl3, and the degree of neurological damage was scored with a blinded method at 4 h and 24 h after drug treatment according to the evaluation criteria in . *P < 0.05, **P < 0.01, ***P < 0.001, in comparison with normal saline.
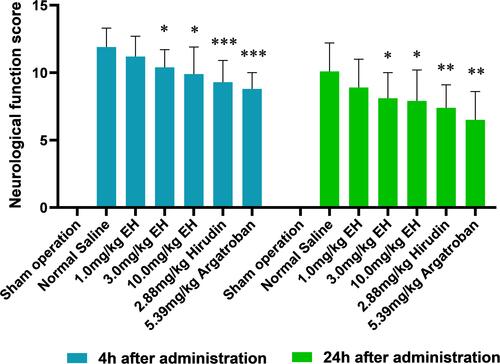
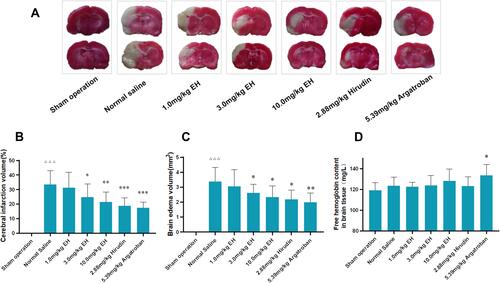
Figure 5 Effects of EH on cerebral infarction in rats. After treatment for 24 h, the rat brain was removed and brain section with 2 mm thick was cut. (A) Rat brain sections staining with TTC. Normal brain tissue was stained red by TTC, while the ischemic brain tissue was not stained. (B) Cerebral infarction volume calculated by the image collection and analysis system software v4.0. (C) Cerebral edema volume calculated by the image collection and analysis system software v4.0. (D) Free hemoglobin content in brain tissue determined by micro free hemoglobin (FHb) determination kit. ΔΔΔP < 0.001, in comparison with sham operation group, *P < 0.05, **P < 0.01, ***P < 0.001, in comparison with normal saline.