Figures & data
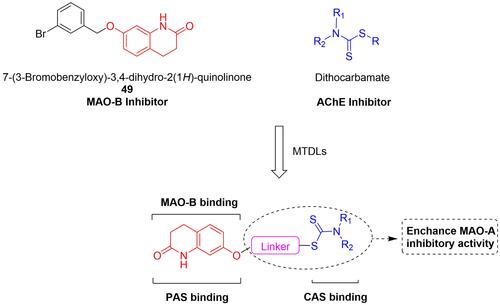
Figure 1 Design strategy of 3,4-dihydro-2(1H)-quinolinone-dithiocarbamate derivatives.
Scheme 1 Synthesis of compounds 3a-i and 3e1-e11. Reagents and conditions: (a) α, ω-dibromoalkanes, K2CO3, acetone, reflux, 6 h, yield: 65%-90%; (b) appropriate secondary amines, CS2, TEA, DMF, r.t., 12 h, yield: 70%–95%.
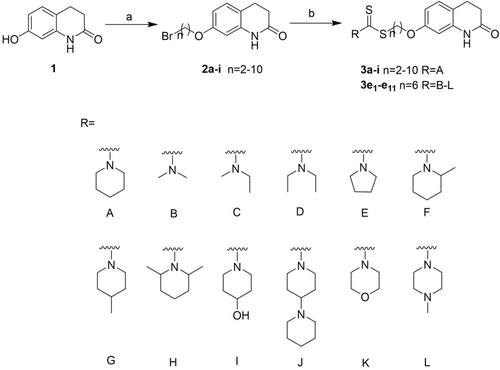
Table 1 Inhibition of ChEs and hMAOs by Compounds 3a-i and 3e1-e11
Table 2 Inhibition of Human ChEs by Selected Compounds
Table 3 Permeability Pe (× 10−6 cm/s) in the PAMPA-BBB Assay for 10 Commercial Drugs in the Experiment Validation
Figure 2 Lineal correlation between experimental and reported permeability of commercial drugs using the PAMPA-BBB assay. Pe (exp.)=0.9286×Pe (bibl.)-0.0268 (R2=0.9602).
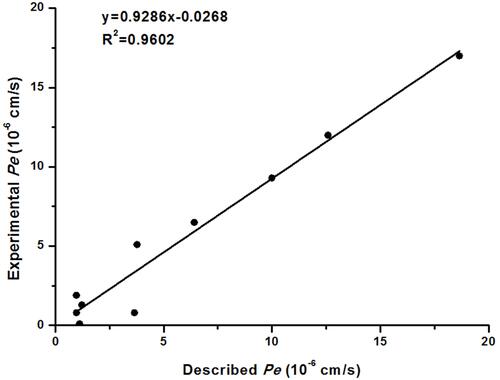
Figure 3 Kinetic study on the inhibition mechanism of hAChE and hMAO-B by compound 3e: (A) Lineweaver-Burk plots of hAChE inhibition kinetics of compound 3e; (B) The Lineweaver-Burk secondary plots of compound 3e on hAChE; (C) and on hMAO-B.
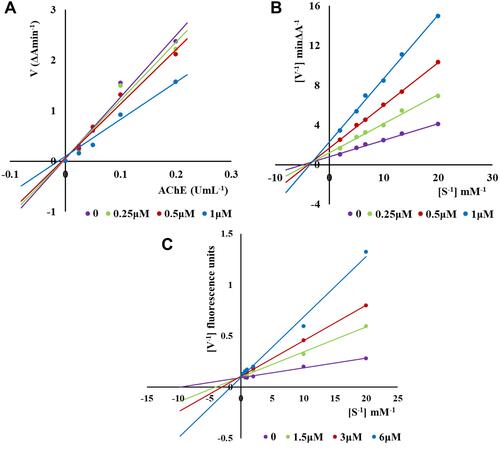
Figure 4 Molecule docking results: (A and C) were 3D and 2D docking models of compound 3e with hAChE; (B and D) were 3D and 2D docking models of compound 3e with hMAO-B. Atom colors: yellow-carbon atoms of 3e, green-carbon atoms of residues of hAChE, blue-nitrogen atoms, red-oxygen atoms, light yellow-sulfur atoms. The figure was generated with MOE.
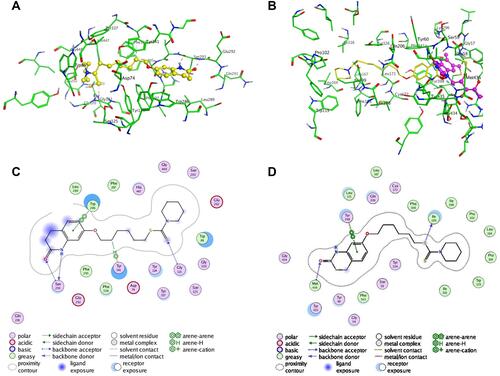
Figure 5 (A) Cytotoxicity of compound 3e and donepezil on PC12 cells. (B) on HT-22 cells. PC12 and HT-22 cells were incubated with different concentrations of compound 3e or donepezil (3.125–100 µM) for 24 h. The results were shown as cell viability after treated with compound 3e or donepezil vs untreated control cells. Date were expressed as mean±SD from three independent experiments.
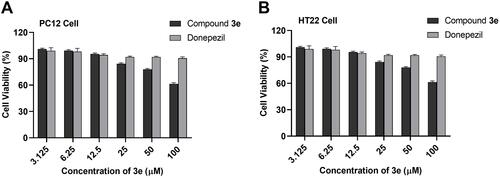
Figure 6 The change on body weight of mice after oral administration of different concentrations of compound 3e. Data were expressed as the average weight±SD of mice.
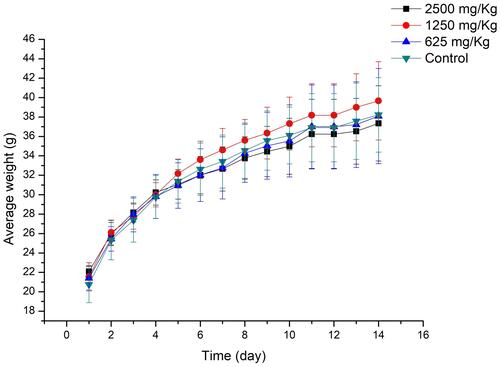
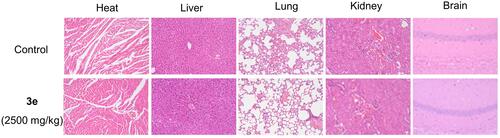
Figure 7 Histological analysis of heart, liver, lung, kidney, and brain for the acute toxicity studies of compound 3e at dosage of 2500 mg/kg in mice; 200 mm indicated the scale bar of images (HE staining). Representative images of HE-stained heart, liver, lung, kidney and brain for each group were shown.