Figures & data
Figure 1 Effects of fusogenic lipid vesicles-rolipram (FLVs-Rol) and non-encapsulated rolipram on xylazine/ketamine anesthesia duration time. (A) Comparison of baseline vs anesthesia duration following administration of 1.6 (n=5), 3.3 (n=6) and 6.6 (n=6) mg/kg of i.v. rolipram. (B) Comparison of baseline vs anesthesia duration time following administration of i.v. FLVs-Rol (1.6 (n=6), 3.3 (n=6) and 6.6 mg/kg (n=6) of rolipram in 12.5 mg/mL of FLV lipid). Each mouse served as its own baseline control and anesthesia duration was measured by the return of the righting reflex. Values represent mean±SD; *P-value ≤ 0.05; **P-value ≤ 0.01.
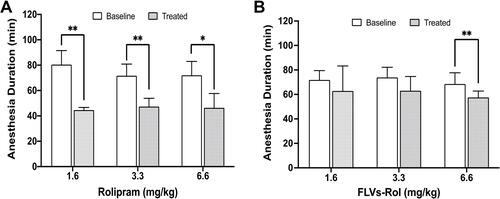
Figure 2 Safety pharmacology studies comparing the effect of i.v. administration of a high dose of free rolipram (6.6 mg/kg) or fusogenic lipid vesicles-rolipram (FLVs-Rol) followed by anesthesia induction at 35-, 60-, 80-, 100-, and 120-min post-dosing. (A) Time course of onset and duration of CNS side-effects following a bolus infusion of rolipram (n=6 per time point). (B) Time course of onset and duration of CNS side-effects following a bolus infusion of FLVs-Rol (n=6 per time point except for 100 min where n=5). Each mouse served as its own baseline control and anesthesia duration was measured by the return of the righting reflex. Values represent mean±SD; *P-value ≤ 0.05; ** P-value ≤0.01.
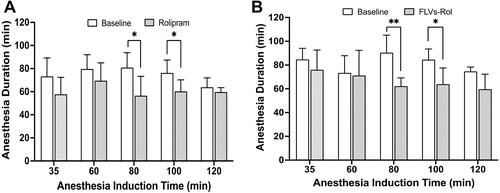
Figure 3 Comparison of liver-to-brain ratios of rolipram, hydroxy-pyrrolidinone rolipram (HPR), decyclopentylated rolipram (DR) and hydroxy-cyclopentyl rolipram (HCR). Tissues from mice in the 3.3 mg/kg of rolipram dose response study groups were harvested at the end of experiments after receiving i.v. free drug (n=4) or fusogenic lipid vesicles-rolipram (FLVs-Rol) (n=4). Rx = treatment; Values represent mean±SD; *P-value ≤ 0.05.
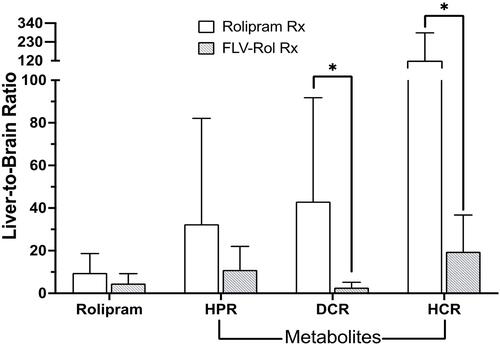
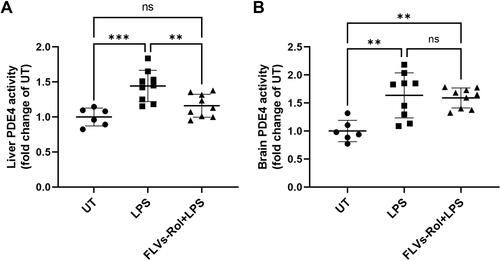
Figure 4 FLVs-Rol inhibits lipopolysaccharide (LPS)-inducible PDE4 activity in the liver but not in the brain. Mice were administered FLVs-Rol, at a dose of 3.3. mg/kg for 24 hours followed by 5 mg/kg LPS i.p. for 3 hours. PDE4 activities were measure in (A) liver and (B) brain tissues of control mice (n=6, PBS vehicle control), mice treated with LPS alone (n=9) and mice pretreated with FLVs-Rol followed by LPS treatment (n=9). PDE4 activity changes are presented as fold change over untreated (UT). Data are presented as individual values with mean±SD. ** P-value ≤0.01; *** P-value ≤0.001.