Figures & data
Figure 1 Flow diagram of literature identification.
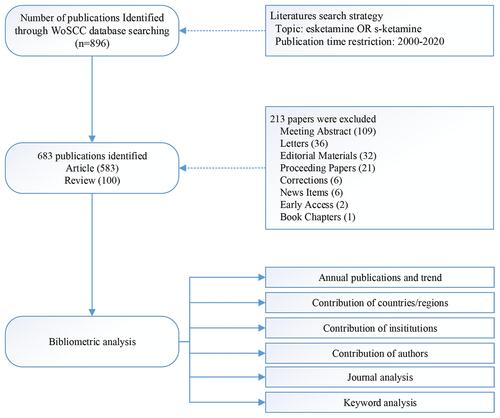
Figure 2 Global trends and sequential growth rate of annual publications related to esketamine research from 2000 to 2020.
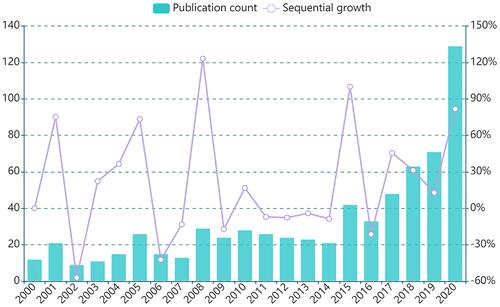
Figure 3 Contribution of countries/regions to the field of esketamine research. (A) World map displaying the global distribution of esketamine research. Different countries are indicated by different colors based on the number of articles published. (B) Distribution and international cooperation of countries/regions involved in esketamine research. The thickness of the line reflects the frequency of the cooperation; the thicker the line, the stronger the cooperation. (C) The total number of publications counts, average citation per item, and H-index of countries that contributed more than 20 publications in this field. (D) Growth trends in the publication quantity of the countries/regions countries that contributed more than 20 publications in esketamine research from 2000 to 2020.
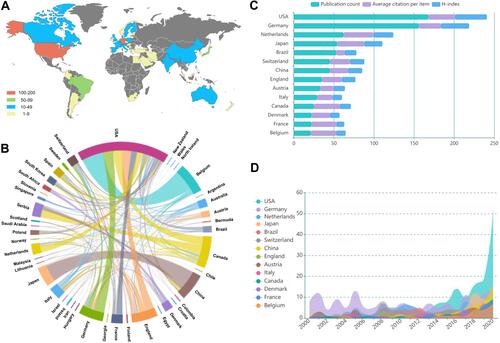
Figure 4 Contribution of institutions in the field of esketamine research. (A) The total number of publications counts, average citation per item, and H-index of institutions that contributed a minimum of 15 papers in this field. (B) Mapping of the co-authorship analysis among top 50 most productive institutions in esketamine research according to VOS viewer. Each node represents an institution, and the node size indicates the number of publications. The connection between the nodes represents a co-authorship relationship, and the thickness of the lines indicates strength (weights on the TLS).
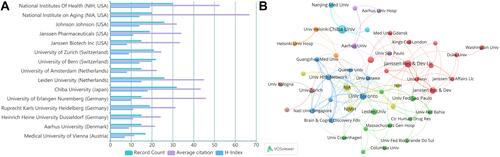
Figure 5 Contribution of authors in the field of esketamine research. (A) The total number of publications counts and average citation per item of authors who contributed at least 10 articles in this field. (B) Mapping of the co-authorship analysis among the authors who published at least five papers on esketamine research according to VOS viewer. Each node represents an institution, and the node size indicates the number of publications. The connection between the nodes represents a co-authorship relationship, and the thickness of the lines indicates strength (weights on the TLS).
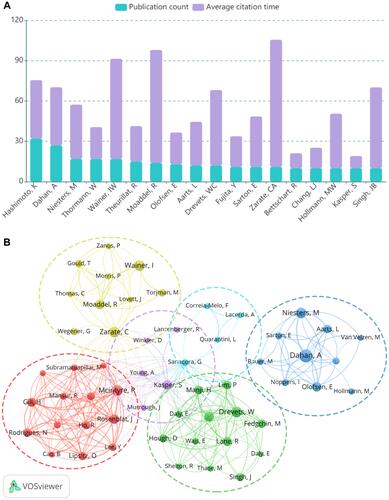
Table 1 The Top 10 Journals for Esketamine Research
Figure 6 Contribution of journals in the field of esketamine research. (A) Growth trends in the publication quantity of the top 10 productive journals in esketamine research from 2000 to 2020. (B) Dual-map overlay of the journals on esketamine research generated by CiteSpace. The labels represent different research subjects covered by the journals. The citing journals are on the left side, while the other side of the map represents the cited journals. Different colored lines correspond to the different paths of references, beginning with the citing map and ending at the cited map. The main citing and cited journals are shown in the red box.
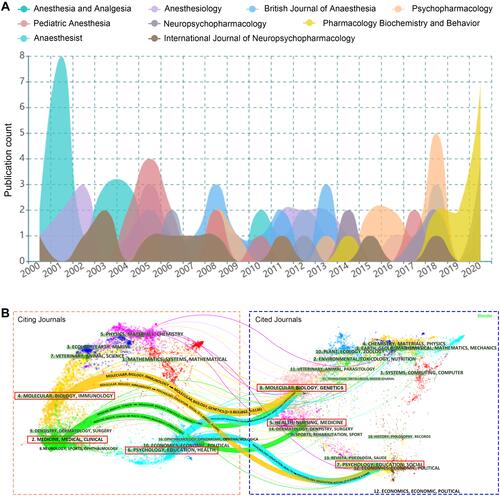
Table 2 Top 20 Keywords in Occurrence Frequency
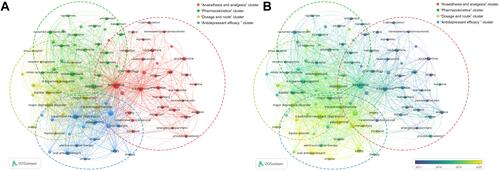
Figure 7 Contribution of keywords in the field of esketamine research. (A) Keyword co-occurrence analysis on esketamine research using VOS viewer. (B) Overlay visualization of the keyword co-occurrence analysis. The purple nodes represent the keywords appearing earlier, whereas the yellow nodes reflect the recently appearing keywords.