Figures & data
Figure 1 A detailed flowchart of the study.
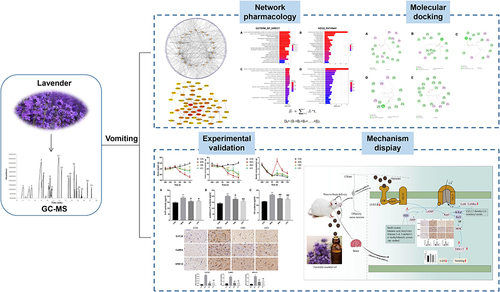
Table 1 Qualitative Results of Lavandula angustifolia Mill. Essential Oil by GC-MS
Figure 2 (A) lon current diagram of LEO. (B) Active ingredient–target, disease–target, and OR–target Venn diagram. (C) PPI network diagram. (D) LEO active component–core target interaction network diagram.
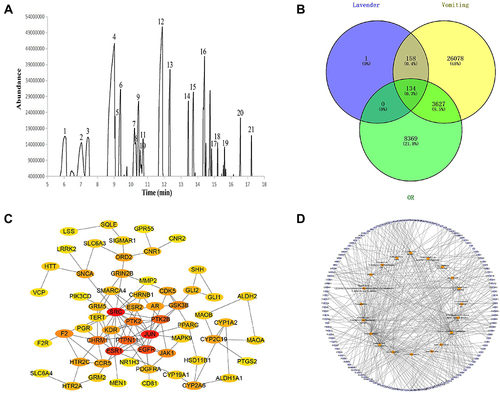
Figure 3 (A and C) Biological process-BP of LEO before and after ranking by weight coefficient algorithm. (B and D) KEGG enrichment analysis of target compounds in LEO before and after ranking by weight coefficient algorithm.
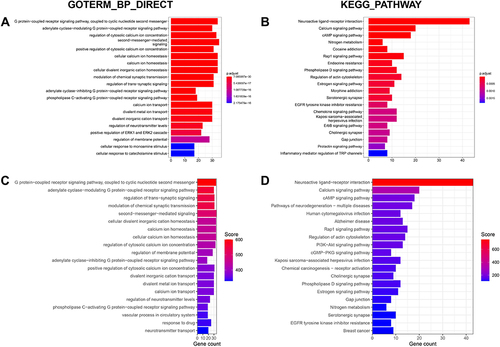
Table 2 Docking Scores of Target Proteins with Their Corresponding Compounds and Positive Controls
Figure 4 Docking results of key target proteins with their corresponding compounds. (A) PDE10A and Linalyl acetateinteraction diagram. (B) PDE10A and Butanoic acid, hexyl esterinteraction diagram. (C) PDE4B and 4-Hexen-1-ol, 5-methyl-2-(1-methylethenyl)-, acetateinteraction diagram. (D) PDE4D and .tau.-Cadinolinteraction diagram. (E) BRAF and (2Z)-3,7-dimethyl-2,6-octadienyl acetate interaction diagram.
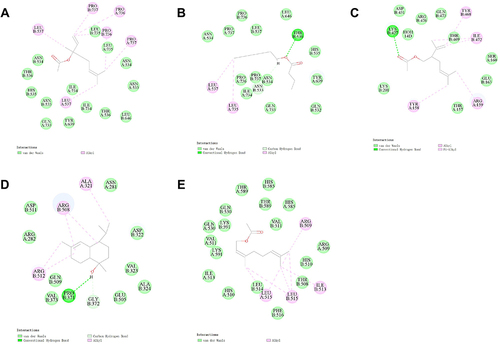
Figure 5 Effects of LEO on cisplatin-induced kaolin and food consumption and body weight of rats (n = l0). (A) Kaolin consumption, (B) Food consumption, and (C) Body weight. The data represent the mean ± standard error. The data were analyzed using two-way ANOVA, followed by Tukey’s post hoc test. *P < 0.05, **P < 0.01 vs control group; #P < 0.05, ##P < 0.01 vs model group, Cisplatin was administrated at 0 h.
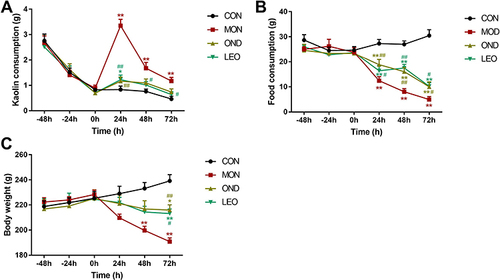
Figure 6 Effects of LEO on 5-HT, substance P, and dopamine levels in serum of model rat. (A) Effect of LEO on 5-HT contents in cisplatin-treated rat serum, (B) Effect of LEO on substance P contents in cisplatin-treated rat serum, and (C) Effect of LEO on dopamine contents in cisplatin-treated rat serum. *P < 0.05, ** P < 0.01 vs control group; #P < 0.05, ##P < 0.01 vs model group.
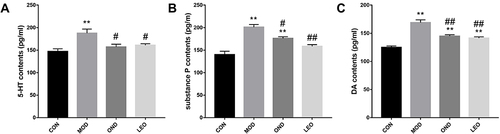
Figure 7 Effects of LEO pretreatment on the expression of 5-HT3R, CaMKII, and ERK1/2 protein in the medulla oblongata tissue of rats with vomiting (Immunohistochemistry, 100), and the changes of 5-HT3R, CaMKII, and ERK1/2 protein expression in the medulla oblongata tissue. *P < 0.05, **P < 0.01 vs control group; #P < 0.05, ##P < 0.01 vs model group.
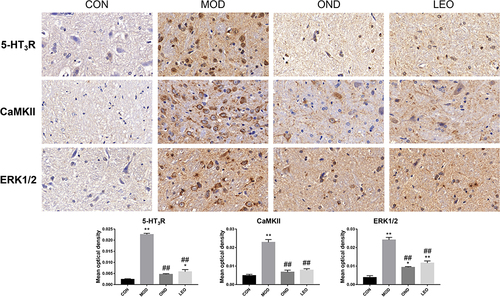
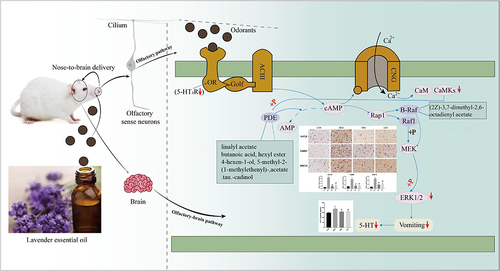
Figure 8 Mechanism display of LEO suppressed vomiting via Ca2+/CaMKII/ERK1/2 signaling pathway. *P < 0.05, **P < 0.01 vs control group; #P < 0.05, ##P < 0.01 vs model group.