Figures & data
Figure 1 Micro-CT and histological analysis of bone regeneration in periodontal bone defect in vivo. The rats were randomly divided into four groups: (a) collagen membranes with rat BMSCs were implanted into the defects, and the rats were injected with CORM-3 intraperitoneally; (b) collagen membranes were implanted into the defects, with CORM-3 injection intraperitoneally; (c) collagen membranes with rat BMSCs were implanted into the defects, and then the rats were injected with 0.9% sodium chloride solution intraperitoneally; (d) collagen membranes were implanted into the defects, with 0.9% sodium chloride solution injection intraperitoneally. (A) Photographs of the general surgical procedure. (B) The longitudinal Micro-CT images (upper panel) and transverse X-ray image (lower panel). Red frames were used to show the defect region with regeneration. (C) The quantitative analysis of the newly formed bone by CT analysis software. (D) H&E staining images of the newly formed bone under different magnifications. The staining image with the whole bone defect zone was labeled by the black dot line and the newly formed bone by the red dot line. The area within the black square was magnified and shown in the lower panel. “D” indicates the dentin. The black asterisk indicates the newly formed bone. The quantitative analysis of the newly formed bone by H&E staining was calculated using Image-Pro Plus 6.0 software. (E) Immunohistological images of newly formed bone by immunohistochemical staining of Runx2. Quantitative analyses of Runx2 expression using Image-Pro Plus 6.0 software. ^ P<0.05 vs control; * P<0.05 as indicated.
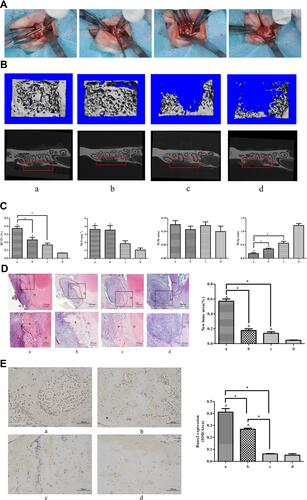
Figure 2 Expressions of miR-195-5p and Wnt3a during osteogenic differentiation of rat BMSCs. Rat BMSCs in the CORM-3 or osteogenic group were cultured in the osteogenic medium with or without 200 μΜ CORM-3, respectively. Rat BMSCs in the control group were cultured in the control medium. (A) RT-qPCR analysis of miR-195-5p on 24 hours, normalized to U6. (B) Representative Western blot images of three independent experiments for Wnt3a protein expression at 24, 48 and 72 hours and quantitative results of Western blot images, using ImageJ software, normalized to Tubulin. The experiment was repeated for three times. Data were presented as the mean±standard deviation (n=3). ^ P<0.05 vs control; * P<0.05 as indicated.
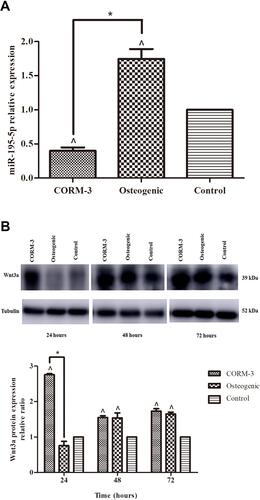
Figure 3 CORM-3-stimulated osteogenic differentiation of rat BMSCs was modified by up- or down-regulation of miR-195-5p. (A) The rat BMSCs were transfected with miR-195-5p mimics and inhibitor. 24 hours after transfection, the cell viabilities were measured. After 48 hours, the expressions of miR-195-5p were determined by RT-qPCR, normalized to U6. (B and C) The rat BMSCs were transfected with miR-195-5p mimics and mimics NC (B), miR-195-5p inhibitor and inhibitor NC (C) for 24 hours and then cultured in the osteogenic medium containing 200 μΜ CORM-3. Meanwhile, cells in the osteogenic, CORM-3 or control group were cultured in the osteogenic medium, osteogenic medium containing 200 μΜ CORM-3 or control medium respectively. After 3 and 7 days, the mRNA expressions of Runx2 and OPN were determined by RT-qPCR, normalized to β-actin. (D and E) The rat BMSCs were cultured as B and C described above. After 3 and 7 days, the protein expressions of Runx2 and OPN were determined by Western blot, then analysed using ImageJ software, normalized to GAPDH. (F) The rat BMSCs were cultured in different mediums as described above. After 14 days, the mineralization was determined by alizarin red staining and semi quantitative analysis. The experiment was repeated for three times. Data were presented as the mean±standard deviation (n=3). ^ P<0.05 vs control; * P<0.05 as indicated.
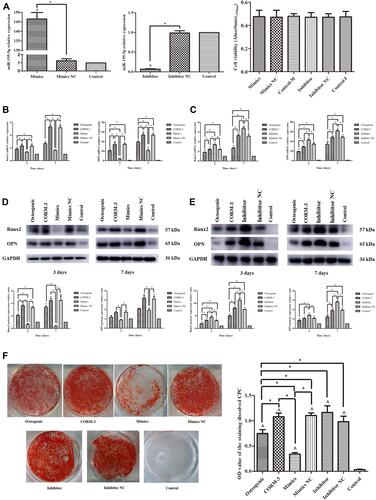
Figure 4 miR-195-5p directly targeted Wnt3a. (A) The design of luciferase reporters with Wnt3a 3′UTR-wt or Wnt3a 3′UTR-mut, the position also showed. (B and C) Western blot images and analysis for Wnt3a protein expression in rat BMSCs after 48 hours transfection with miR-195-5p mimics or mimics NC (B), miR-195-5p inhibitor or inhibitor NC (C), using ImageJ software, normalized to Tubulin. (D) Effect of miR-195-5p mimics on luciferase activity in 293T cells transfected with either the 3′UTR-wt reporter or the 3′UTR-mut reporter for Wnt3a. The experiment was repeated for three times. Data were presented as the mean±standard deviation (n=3). ^ P<0.05 vs control; * P<0.05 as indicated.
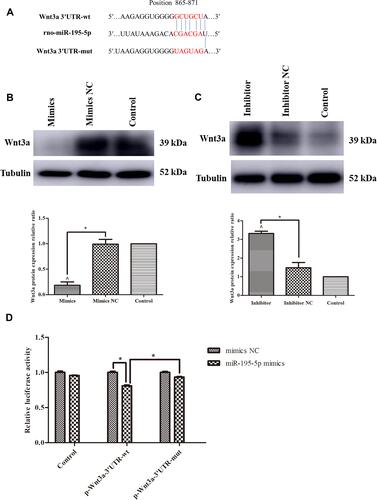
Figure 5 CORM-3-stimulated osteogenic differentiation of rat BMSCs was modified by up- or down-regulation of Wnt3a. (A) The rat BMSCs were transfected with pcDNA3.1-Wnt3a and Wnt3a siRNA. 24 hours after transfection, the cell viabilities were measured. After 48 hours, the protein expressions of Wnt3a were determined by Western blot and image analysis. (B and C) The rat BMSCs were transfected with pcDNA3.1-Wnt3a or NC (B), Wnt3a siRNA or NC (C) for 24 hours and then cultured in the osteogenic medium containing 200 μΜ CORM-3. Meanwhile, cells in the CORM-3 or control group were cultured in the osteogenic medium containing 200 μΜ CORM-3 or control medium respectively. After 3 and 7 days, the mRNA expressions of Runx2 and OPN were determined by RT-qPCR, normalized to β-actin. (D and E) The rat BMSCs were cultured as B and C described above. After 3 and 7 days, the protein expressions of Runx2 and OPN were determined by Western blot, then analysed using ImageJ software, normalized to GAPDH. (F) The rat BMSCs were cultured in different mediums as described above. After 14 days, the mineralization was determined by alizarin red staining and semi quantitative analysis. The experiment was repeated for three times. Data were presented as the mean±standard deviation (n=3). ^ P<0.05 vs control; * P<0.05 as indicated.
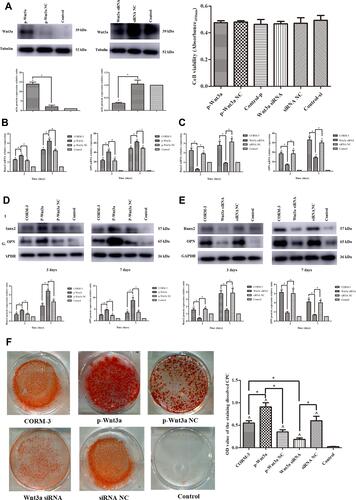
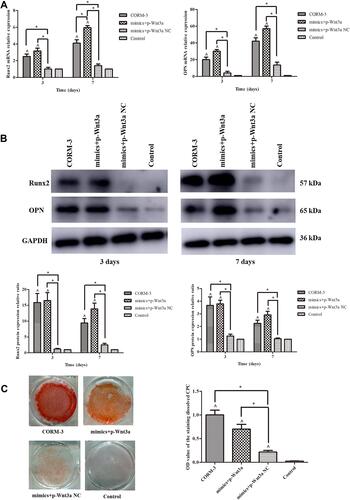
Figure 6 Decreased osteogenic differentiation capacity by miR-195-5p up-regulation was rescued with Wnt3a overexpression. (A) The rat BMSCs were co-transfected with miR-195-5p mimics and pcDNA3.1-Wnt3a, miR-195-5p mimics and NC for 24 hours and then cultured in the osteogenic medium containing 200 μΜ CORM-3. Meanwhile, cells in the CORM-3 or control group were cultured in the osteogenic medium containing 200 μΜ CORM-3 or control medium respectively. After 3 and 7 days, the mRNA expressions of Runx2 and OPN were determined by RT-qPCR, normalized to β-actin. (B) The rat BMSCs were cultured in different mediums as described above. After 3 and 7 days, the protein expressions of Runx2 and OPN were determined by Western blot, then analysed using ImageJ software, normalized to GAPDH. (C) The rat BMSCs were cultured in different mediums as described above. After 14 days, the mineralization was determined by alizarin red staining and semi quantitative analysis. The experiment was repeated for three times. Data were presented as the mean±standard deviation (n=3). ^ P<0.05 vs control; * P<0.05 as indicated.