Figures & data
Figure 1 The herb-target network of Wendan Decoction (WDD) treating Generalized Anxiety Disorder (GAD). Yellow nodes represent all herbs of WDD. Blue nodes represent the intersection targets of WDD and GAD. Common targets of multiple herbs are located in the center of the network.
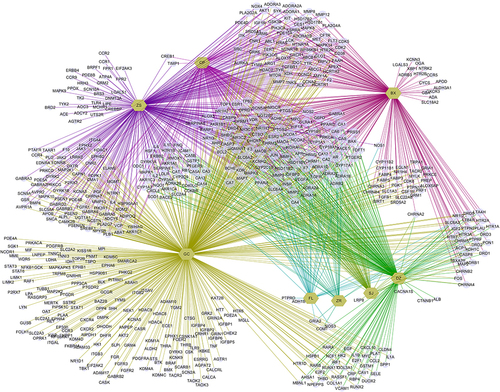
Figure 2 PPI topological analysis of Wendan Decoction treating Generalized Anxiety Disorder. (A)PPI network of 569 targets. (B) The subnet of PPI with 142 hub targets screened based on twice medium degree. (C) According to the Betweenness Centrality, Closeness Centrality, Degree Centrality and Eigenvector Centrality separately, TOP 10 targets in subnet from each criterion were labeled yellow. (D) Venn diagram of 4 topological analysis data. TNF, SRC, IL-6 and AKT1 were common targets.
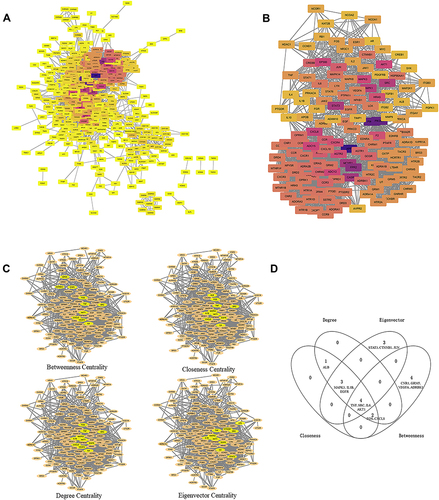
Figure 3 (A) KEGG enrichment analysis of 569 intersection targets of Wendan Decoction and Generalized Anxiety Disorder. The redder bubble is, the less P value is. (B) Network of top 5 KEGG pathways and their corresponding targets. Red nodes represent pathways. Yellow nodes represent related targets.
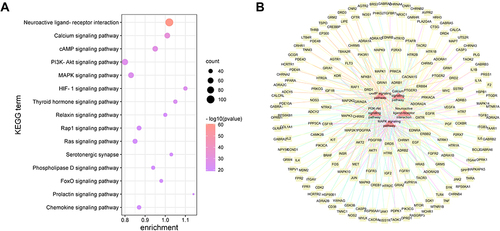
Table 1 Chemical Identification of Wendan Decoction
Figure 4 Identification of active ingredients of Wendan Decoction. (A) Total ion chromatography (TIC) on positive of Wendan Decoction. (B) TIC on negative of Wendan Decoction. (C-F) Extraction ion chromatography of Wendan Decoction. (C) Identification of naringenin. (D) Identification of glabridin. (E) Identification of luteolin and baicalein. (F) Identification of coniferyl aldehyde, syringaldehyde, quercetin, beta-sitosterol and hederagenin.
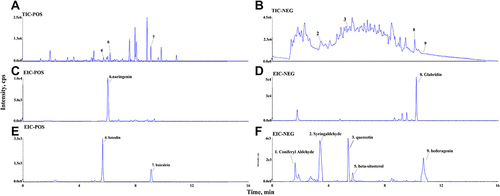
Figure 5 Behavioristic changes of mice in each group. (A) Representative trajectory diagram of each group in open field test. (B) Representative heat maps of the movement of each group in open field test. (C) Representative trajectory diagram of each group in elevated plus maze. (D) Representative heat maps of the movement of each group in elevated plus maze. (E) Total time spent in the central zone of open field. (F) Percentage of number of entries in the open arms. (a) blank control group; (b) repeated restraint stress (RRS) model group; (c) Wendan Decoction group; (d) paroxetine group. *P < 0.05, compared with blank control group; #P < 0.05, compared with RRS model group.
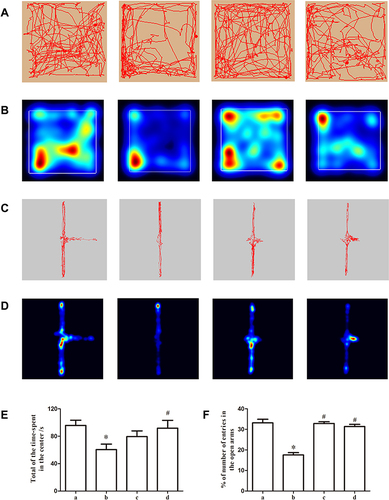
Figure 6 Plasma corticosterone concentration of mice in each group. (A) blank control group; (B) repeated restraint stress (RRS) model group; (C) Wendan Decoction group; (D) paroxetine group. *P < 0.05, compared with blank control group; #P < 0.05, compared with RRS model group.
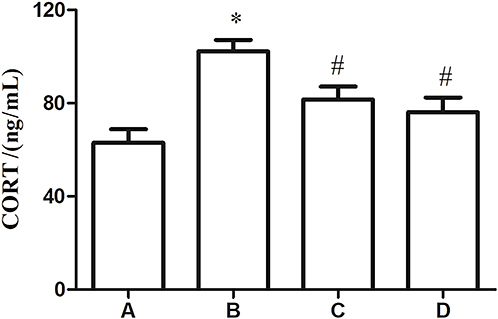
Figure 7 Percent of IL-6+ T lymphocytes in blood of mice in each group. (A) Representative flow cytometric analysis. (I)Sorting cell fragments and cells; (II)Sorting cells and T lymphocytes; (III)sorting T lymphocytes and CD3+ T lymphocytes; (IV)Sorting CD3+ T lymphocytes and CD3+ CD4+ T lymphocytes; (V)Sorting CD3+ CD4+ T lymphocytes and IL-6+ CD4+ T lymphocytes. (B) The proportion of CD3+ lymphocytes. (C) The proportion of CD4+ lymphocytes. (D) The proportion of IL-6+ CD4+T lymphocytes. (a) blank control group; (b) repeated restraint stress (RRS) model group; (c) Wendan Decoction group; (d) paroxetine group. *P < 0.05, compared with blank control group; #P < 0.05, compared with RRS model group.
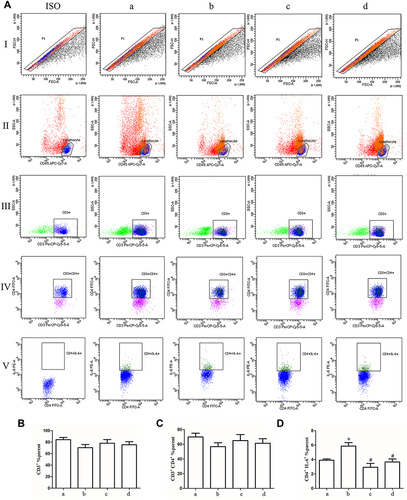
Figure 8 Effects of different concentrations of Wendan Decoction (WDD) on BV2 microglial cell proliferation. *P < 0.05, the proliferation of BV2 cells was inhibited, compared with blank control group.
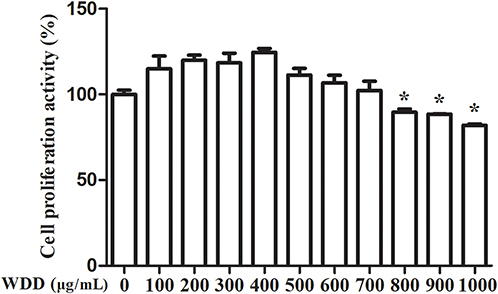
Figure 9 Effect of different concentrations of Wendan Decoction (WDD) and 100μmol/L Dexamethasone (DEX) on pro-inflammatory factors of IL-6 induced BV-2 microglia cells, respectively. (A) Concentrations of TNF-α in the cell supernatants. (B) Concentrations of PEG2 in the cell supernatants. (C) Concentrations of IL-1β in the cell supernatants. *P < 0.05, compared with blank control group; #P < 0.05, compared with IL-6-induced group.
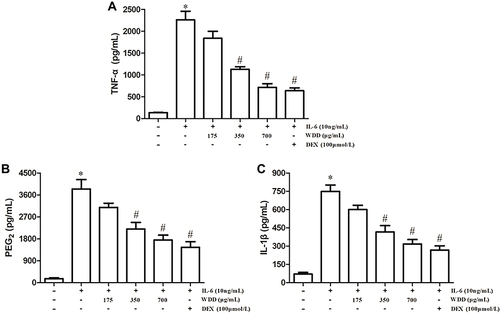
Figure 10 Effect of different concentrations of Wendan Decoction (WDD) and 100μmol/L Dexamethasone (DEX) on PI3K/AKT and MAPK signaling pathways of IL-6 induced BV-2 microglia cells. (A) Western blots of PI3K, p-PI3K, AKT, p-AKT, MAPK p38 and p-MAPK p38. (B) Quantification analysis of p-PI3K/PI3K. (C) Quantification analysis of p-AKT/AKT. (D) Quantification analysis of p-p38/p38. *P < 0.05, compared with blank control group; #P < 0.05, compared with IL-6-induced group; ΔP < 0.05, compared with 700μg/mL WDD intervention group.
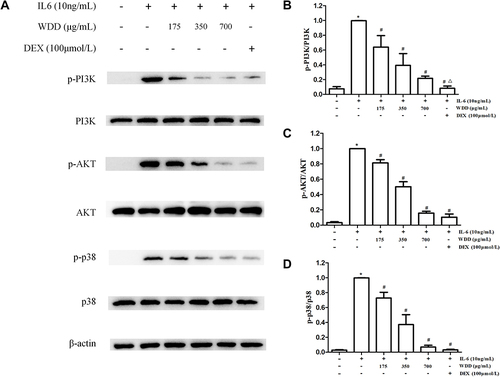
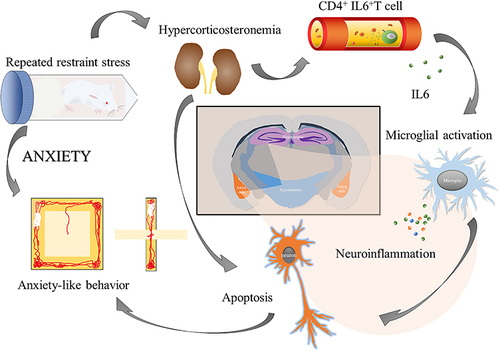
Figure 11 The hypothesis of Wendan Decoction treating Generalized Anxiety Disorder.