
Figures & data
Table 1 Baseline Characteristics of the Participants
Figure 1 Study flowchart.
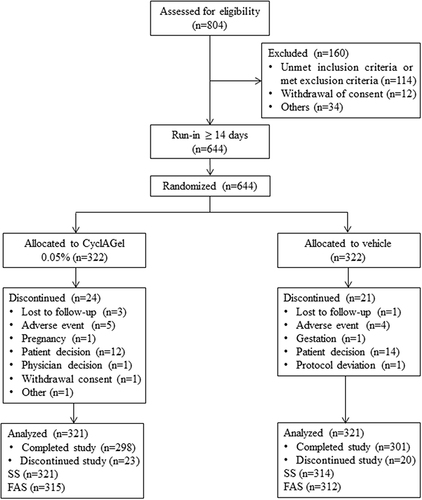
Figure 2 The proportion of subjects with at least a 1-point improvement in ICSS from baseline at day 14, 42, and 84 in the CyclAGel (n=315) and vehicle (n=312) groups. * P<0.025; ** P<0.0001.
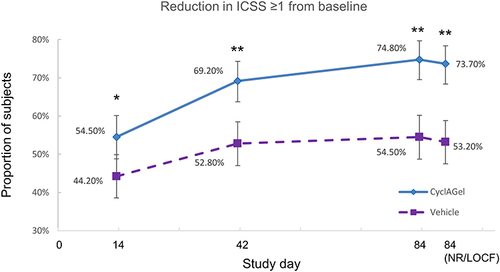
Figure 3 Subgroup analyses for the proportion of subjects with at least a 1-point improvement in ICSSat day 84 from baseline. The squares represent the mean value, and the lines represent the 95% CI. Differences between groups with 95% CI including 0% are considered not statistically significant.
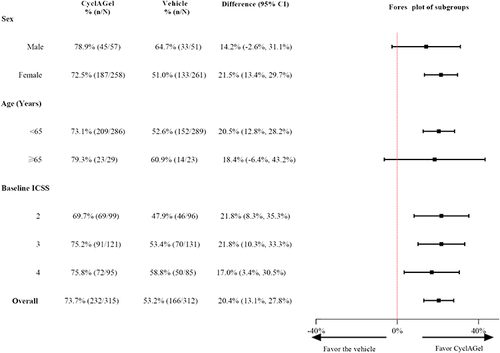
Table 2 Changes from Baseline in DED Signs of the Study Eye at Days 14, 42, and 84
Table 3 Changes in Binocular Symptom Scores from Baseline at Days 14, 42, and 84
Figure 4 Changes from baseline in DED signs of the study eye at day 14, 42, and 84 in the CyclAGel (n=315) and vehicle (n=312) groups. (A) Inferior corneal staining score (ICSS); (B) Oxford scale scoring of corneal and conjunctival fluorescein staining; (C) break-up time (BUT); (D) Schirmer tear test. * P<0.05. ** P<0.01.
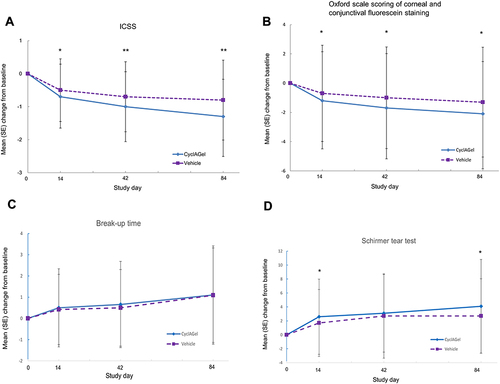
Table 4 Incidence of Treatment-Emergent Adverse Events (TEAEs)