Figures & data
Figure 1 MiR-106a-5p was upregulated in hypoxic glioma cells. (A) The level of miR-106a-5p in HEB, U87MG, SHG44 and U251MG cells was detected by RT-qPCR. (B) The level of HIF-1α in hypoxic or normoxia glioma cells was assessed by RT-qPCR. (C) The level of miR-106a-5p in hypoxic or normoxia glioma cells was assessed by RT-qPCR. **P< 0.01 compared to HEB or normoxia.
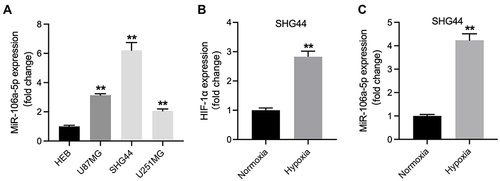
Figure 2 MiR-106a-5p could be transferred from hypoxic glioma cells to glioma cells via exosomes. (A) Exosomes were isolated from hypoxic or normoxia glioma cells (H-exo or N-exo), and were observed by TEM. (B) NTA was applied for exosome identification. (C) The expressions of CD81, CD63 and calnexin in normoxia cells, hypoxia cells, H-exo or N-exo were examined by Western blot. (D) The exosomes absorbed by glioma cells were observed by fluorescence staining. (E) Glioma cells were treated with N-exo, H-exo or H-exo + miR-106a-5p inhibitor. The level of miR-106a-5p in glioma cells was assessed by RT-qPCR. **P< 0.01 compared to control. ##P< 0.01 compared to hypoxia Exo.
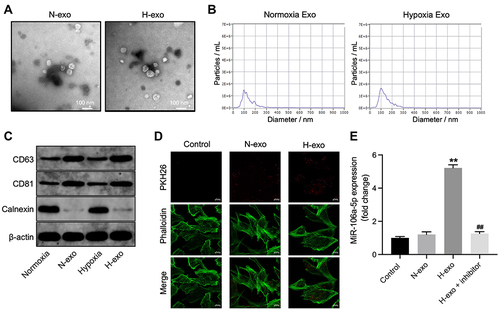
Figure 3 Exosomes derived from hypoxic glioma cells reduced TMZ sensitivity in glioma cells through carrying miR-106a-5p. Glioma cells were treated with TMZ, TMZ + N-exo, TMZ + H-exo or TMZ + H-exo + miR-106a-5p inhibitor. (A) The viability of glioma cells was assessed by CCK8 assay. (B) The proliferation of glioma cells was detected by EdU staining. (C) The apoptosis of glioma cells was assessed by flow cytometry. **P< 0.01 compared to control. ##P< 0.01 compared to TMZ. ^^P< 0.01 compared to TMZ + H-exo.
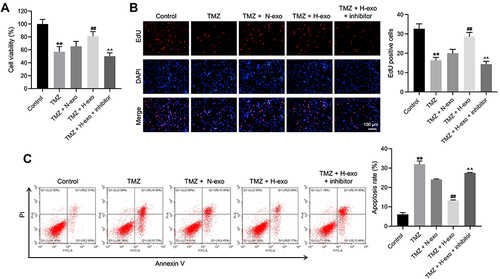
Figure 4 PTEN was identified to be the downstream target of miR-106a-5p. (A) The downstream mRNA of miR-106a-5p was predicted by targetscan. (B) The relative luciferase activity in WT/MT-PTEN was assessed by dual luciferase assay. (C) Glioma cells were transfected with mimics-ctrl or miR-106a-5p mimics. The level of PTEN in glioma cells was investigated by RT-qPCR. **P< 0.01 compared to control.
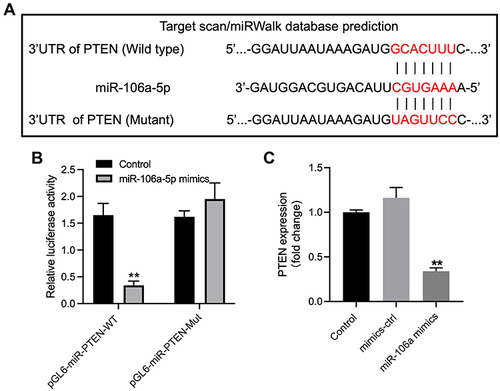
Figure 5 Exosomes derived from hypoxic glioma cells reduced TMZ sensitivity in glioma cells through inactivation of Akt signaling. (A) The protein levels of Akt, p-Akt, p53, Bax and PTEN in glioma cells were assessed by Western blot. (B–E) The relative expressions Akt, p-Akt, p53, Bax and PTEN in glioma cells were quantified by normalizing to β-actin. **P< 0.01 compared to control. ##P< 0.01 compared to TMZ. ^^P< 0.01 compared to TMZ + H-exo.
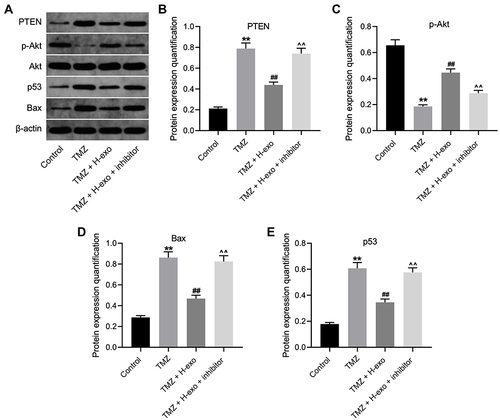
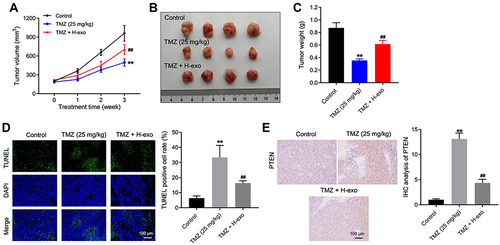
Figure 6 Exosomes derived from hypoxic glioma cells reduced TMZ sensitivity in glioma cells in vivo. (A) The tumor volume of mice was calculated. (B) The tumor tissues of mice were collected and pictured. (C) The tumor weight of mice was recorded. (D) The cell apoptosis of tumor tissues in mice was detected by TUNEL staining. (E) The level of PTEN in tumor tissues of mice was investigated by IHC staining. **P< 0.01 compared to control. ##P< 0.01 compared to TMZ.