Figures & data
Table 1 Investigated Variables in Plackett-Burman Experimental Design
Table 2 Composition of Adapalene Loaded Microsponges and the Observed Values of the Dependent Responses
Figure 1 Continued.
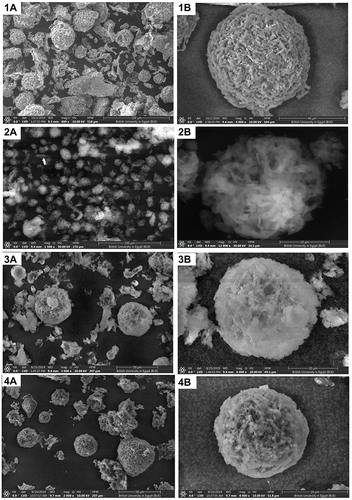
Figure 1 Continued.
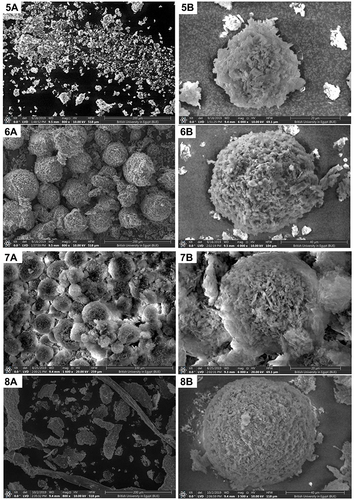
Figure 1 The SEM images of F1 to F12, where 1A to 12A showing images of the field and 1B to 12B showing images of a single microsponge particle.
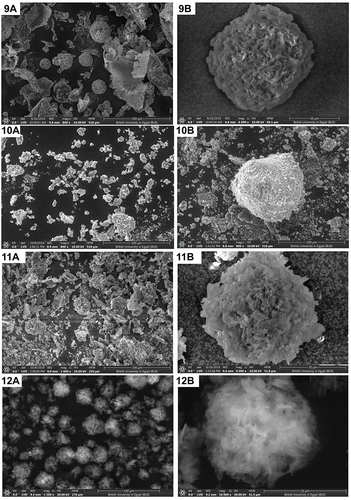
Table 3 Statistical Analysis of Variance (ANOVA) of the Responses (Y1−Y4)
Figure 2 Three-dimensional (3D) of Plackett Burman design generated response surface plots of: (A) entrapment efficiency percentages in terms of DF, (B) production yield percentage in terms of DF, (C) particle size in terms of AF, and (D) morphology in terms of AC. The change in colour from blue-green-red indicates increase in response value.
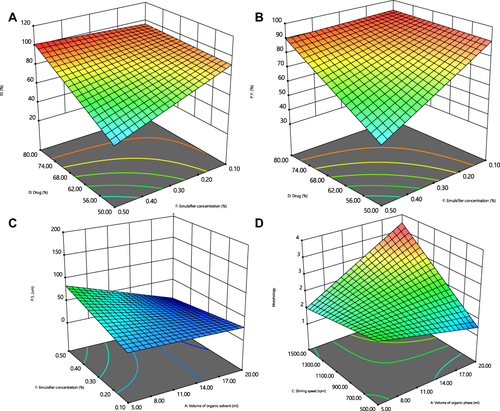
Table 4 In vitro Cytotoxicity Results on Different Cell Lines
Figure 3 Cytotoxicity profile of the free ADA, ADA-MS-EC and ADA-MS-EUD against A431 and M10 cell lines.
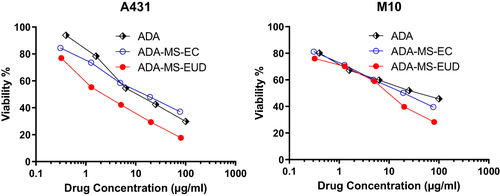
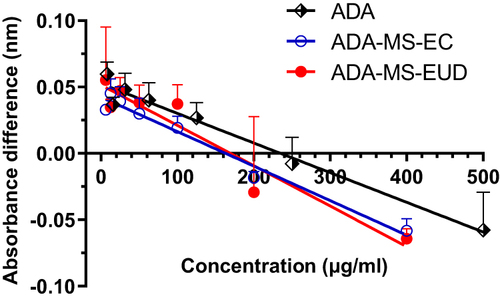
Figure 4 Cell viability assay after UVA irradiation and exposure to different concentrations of Adapalene in form of the free ADA, ADA-MS-EC and ADA-MS-EUD against HFB-4 cell line. Results were compared for each concentration using one-way ANOVA followed by Tukey’s post hoc test. ap < 0.0005 compared with respective ADA relative cell viability percent, bp < 0.0001 compared with respective ADA-MS-EUD relative cell viability percent.
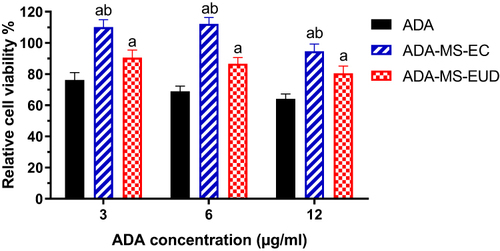
Figure 5 Minimum inhibitory concentration determination after exposure to different concentrations of ADA, ADA-MS-EC and ADA-MS-EUD against P. acne.