Figures & data
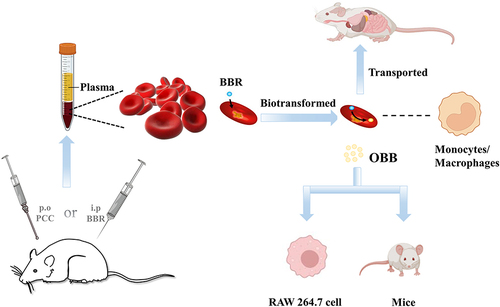
Figure 1 The relationship between Phellodendri Chinensis Cortex (PCC), berberine (BBR) and oxyberberine (OBB).
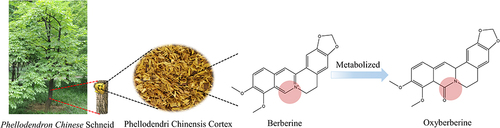
Figure 2 BBR in PCC extract was analyzed using HPLC. (S1) PCC extract with 95% ethanol. The purity of BBR was over 95% and the content of BBR was over 3.0%. (S2) BBR standard solution.
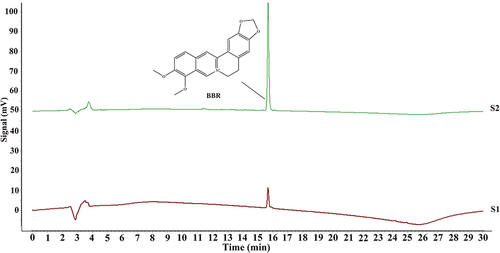
Figure 3 HPLC chromatograms of blood samples with BBR and OBB. (S1) Blank whole blood treated with acetonitrile precipitation. (S2) Blank whole blood hydrolyzed by HCl. (S3–S5) Whole blood spiked with BBR, OBB, and IS standard solutions. (S6) Plasma samples obtained following intraperitoneal injection of BBR in 0.5 h. (S7) Erythrocyte samples acquired after intraperitoneal administration of BBR in 0.5 h. (S8) BBR hydrolyzed by HCl.
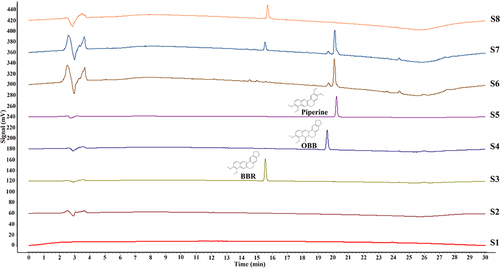
Table 1 Accuracy, Recovery, and Intra-Day and Inter-Day Precisions of BBR and OBB in Plasma and Erythrocytes (n = 6)
Table 2 The Stability (RSD %) of BBR and OBB in Plasma and Erythrocytes Under Three Different Storage Conditions (n = 6)
Figure 4 Blood concentration–time curves of BBR and OBB post oral administration of PCC. Blood concentration–time curve of BBR (A) and OBB (B). Data are expressed as mean ± S.E.M. (n = 6).
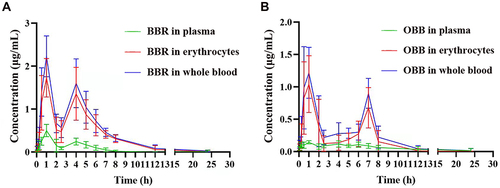
Table 3 The Concentration of BBR and OBB in Plasma and Whole Blood After Incubation in vitro in 2 h (n = 6)
Figure 5 (A) Concentrations of BBR and its metabolite OBB measured in rats after intraperitoneal injection of BBR at the dose of 2.5 mg/kg body weight at 0.5, 1, and 2 h. (B) Trend variation of plasma/erythrocytes partition coefficients of BBR and OBB in vivo at 0.5, 1 and 2 h. Data are expressed as mean ± S.E.M. (n = 6).
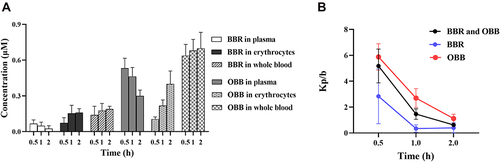
Figure 6 The proportion of BBR and OBB in whole blood after intraperitoneal injection of BBR at the dose of 2.5 mg/kg at 0.5, 1, and 2 h.
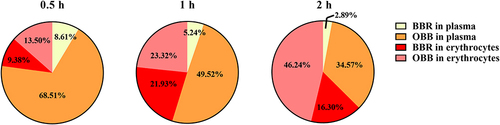
Figure 7 Routine blood tests in rats after intraperitoneal injection of BBR at 0.5, 1, and 2 h at the dose of 2.5 mg/kg body weight. Changes in numbers of erythrocytes (A), Hb (B), and immune cells (C). (D) Significant correlations between drug concentration in erythrocytes and the amounts of monocytes. Data are presented as mean ± S.E.M. (n = 3). *p < 0.05 vs the normal group.
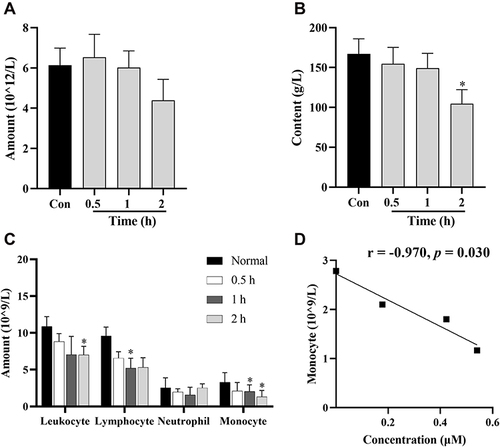
Figure 8 Distribution profiles of BBR and OBB in the liver (A), spleen (B), heart (C), lung (D), kidney (E), intestine (F), brain (G), muscle (H), and pancreas (I) in rats post oral administration of 400 mg/kg BBR at 1, 2, 4, and 6 h. Data are presented as mean ± S.E.M. (n = 6).
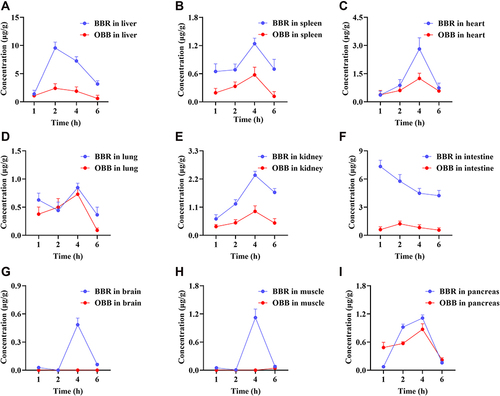
Figure 9 (A) The amount of CD68+ macrophages in different tissues of normal rats (n = 3). (B) The concentrations of BBR and OBB in tissues at 1, 2, 4 and 6 h (n = 6). Data are presented as mean ± S.E.M.
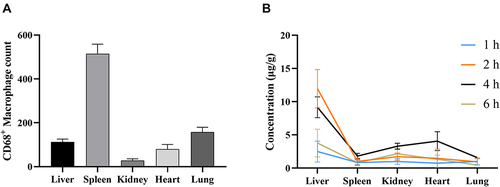
Figure 10 Cell viability of RAW 264.7 macrophages incubated with OBB and BBR with or without LPS (1 μg/mL) for 24 h. Cells were exposed to different drugs: (A) OBB, (B) OBB and LPS, (C) BBR, (D) BBR and LPS. The cell viability was determined by CCK8 assay. Data are presented as mean ± S.E.M. (n = 3). ##p < 0.01 vs the control group.
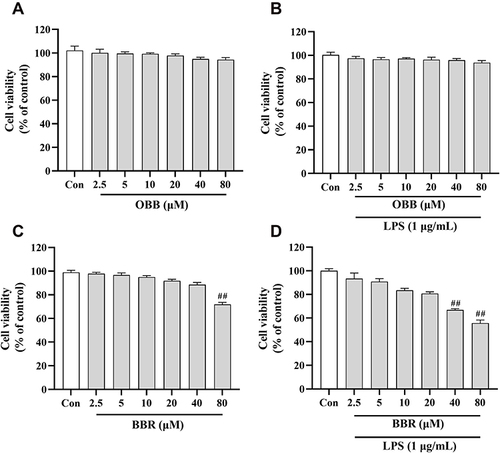
Figure 11 Comparison of anti-inflammatory effects between BBR and OBB in vitro and in vivo. (A–C) Effect of OBB on secretions of pro-inflammatory mediators TNF-α, IL-6, and IL-18 in LPS-induced RAW 264.7 macrophages. (n = 3). (D) Vascular permeability in mice induced by acetic acid. The capillary permeability was described by the content of Evans blue expelled into peritoneal cavity, which was measured by the OD of the supernatant (n = 10). Data are presented as mean ± S.E.M. &&p < 0.01 vs the Control group; ##p < 0.01 vs the Model group; *p < 0.05 vs the BBR group.
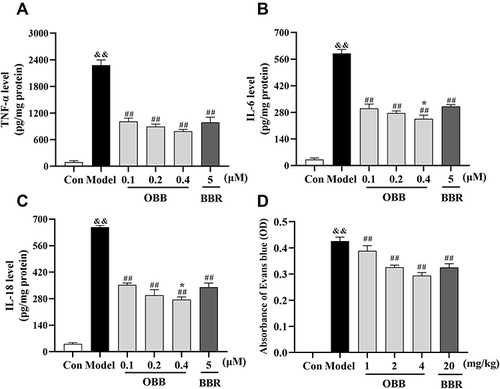
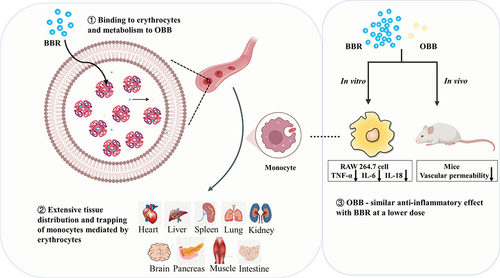
Figure 12 Summary scheme of the scenario for the pharmacokinetics and anti-inflammatory pharmacodynamics of BBR and its active metabolite OBB from the perspective of BBR-erythrocytes self-assembly delivery system.