Figures & data
Table 1 Chemical Information of the Active Compounds of Triptolide
Figure 1 (A) The 2D structure of triptolide. (B) Venn diagram of the overlapping genes of triptolide and MN.
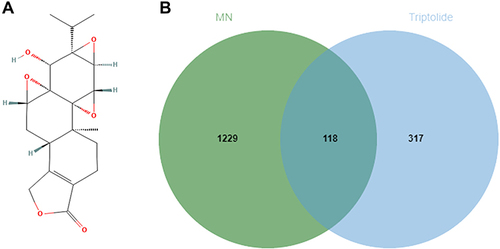
Figure 2 PPI network for triptolide in treatment of MN. (A) PPI network (118 nodes and 1729 edges) of the triptolide ingredient targets against MN, which was produced using STRING. The node size and color depth are proportional to the degree values. (B) The high-relevant targets’ intersection of MN and triptolide. The top 10 targets were screened according to their MCC score, including mTOR, STAT3, CASP3, EGFR, AKT1, HIF1A, MMP9, SRC, HRAS and HSP90AA1.
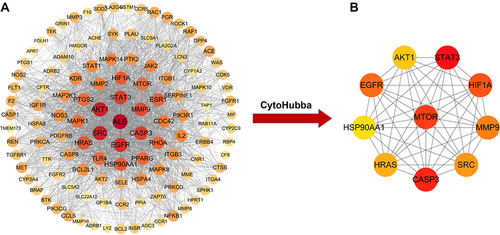
Figure 3 GO and KEGG pathway enrichment analysis of triptolide in treatment of MN. (A) KEGG pathway analysis. The numbers on the X-axis indicate the number of genes annotated to this pathway. Different colors indicate different KEGG pathway classifications. (B) KEGG pathway circle diagram. First circle: the outermost circle indicates the classification of the enriched pathway, and the outside of the circle is a coordinate scale for the number of genes, with different colors representing different classifications. Second circle: the number of that classification in the background genes and the P-value. Third circle: showing the total number of foreground genes annotated to that pathway. Fourth circle: Rich-Factor value of each classification with each cell of the background auxiliary line indicating 0.1. (C–E) GO enrichment analysis of the key targets.
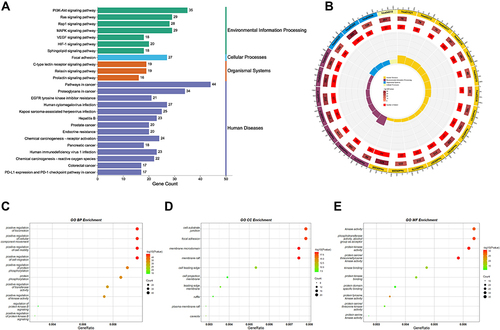
Figure 4 “Target-Pathway” Network of triptolide against MN. (A) The nodes in the network display targets and the signaling pathways in triptolide and MN are represented by the triangle nodes. (B) The targets of triptolide enrichment in the PI3K/AKT signaling pathway. The dark Orange targets enriched by top 10 targets that were screened according to their MCC score and PI3K/AKT signaling pathway together.
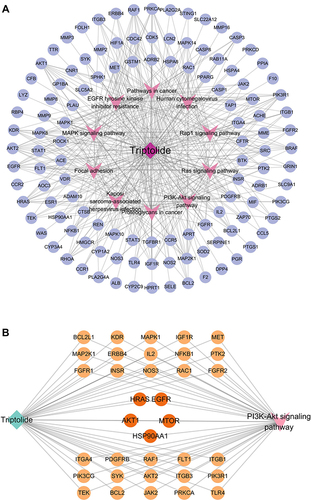
Table 2 Virtual Molecular Docking of Triptolide and Its Targets
Figure 5 Molecular docking of triptolide with AKT1 (A), mTOR (B), and PIK3R1 (C) shown as 3D diagrams. The number indicates the length of the hydrogen bond.
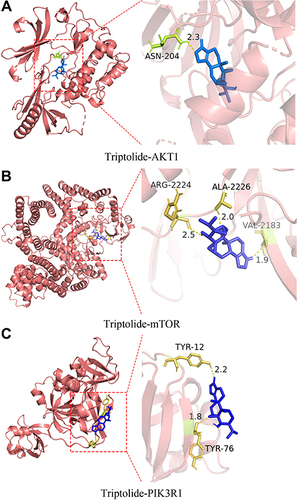
Figure 6 The effect of triptolide on the biochemical parameters of PHN rats. (A) The contents of 24 h urine protein (n = 10). (B–E) The levels of ALB, TC, TG, and LDL in serum at last week (n = 10). *p < 0.05, **p < 0.01.
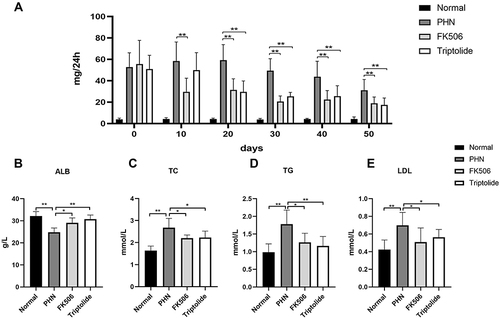
Figure 7 The effect of triptolide on renal pathology in PHN rats. Microstructural images of representative renal tissues stained by H&E, PAS, and PASM (400 × magnification) (scale bar = 20 μm).
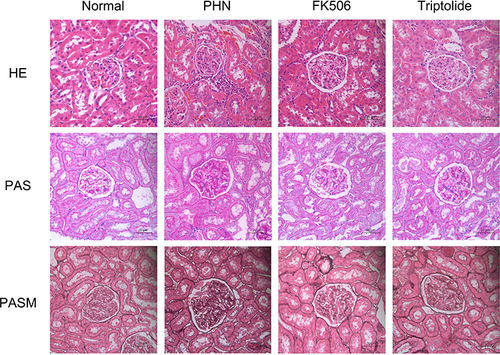
Figure 8 The effect of triptolide on podocyte injury in PHN rats. (A) Immunohistochemistry staining of desmin (400× magnification). (B) Analysis of the IOD of desmin. (C) Immunofluorescence staining of synaptopodin (400 × magnification) (scale bar = 20 μm). (D) Representative Western blots showing the detection of synaptopodin. (E) Relative protein expression of synaptopodin. Data are expressed as mean ± SD, n = 6. *p < 0.05, **p < 0.01.
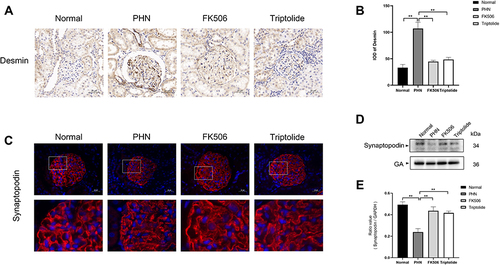
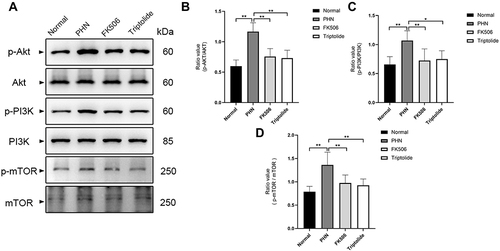
Figure 9 Validation of the predicted target proteins with Western blotting. (A) Representative Western blots showing the detection of p-AKT, AKT, p-PI3K, PI3K, p-mTOR, mTOR. (B–D) The phosphorylation levels of AKT, PI3K and mTOR decreased after treatment of triptolide. Data are expressed as mean ± SD, n = 6. *p < 0.05, **p < 0.01.