Figures & data
Figure 1 The Etp prodrug was synthesized by linking the phenolic hydroxyl group of Etp with PEG.
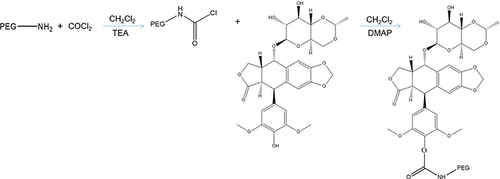
Figure 2 EtpP–CDDP NLCs and TEM. EtpP–CDDP NLCs were prepared using film ultrasound. The morphology of EtpP–CDDP NLCs was examined using transmission electron microscopy (TEM).
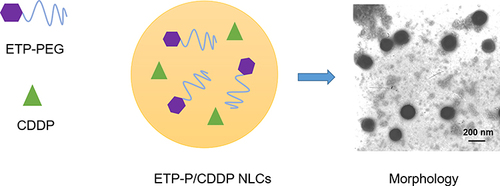
Table 1 Characterization of NLCs (means ± SD, n=8)
Figure 3 The stability of NLCs evaluated in PBS at 2°C–8°C (A) and cell-culture medium (DMEM + 10% FBS) at 37°C (B) by changes in size with time.
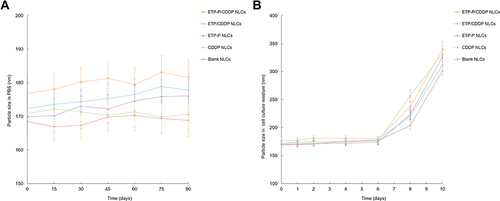
Figure 4 In vitro release of Etp (A) and CDDP (B) from NLCs was analyzed using dialysis. NLCs (2 mL) were put in a dialysis bag, immersed in 100 mL PBS in the presence of 10% FBS (pH 7.4), and placed on a shaking bed at 37°C with a rotation speed of 100 rpm.
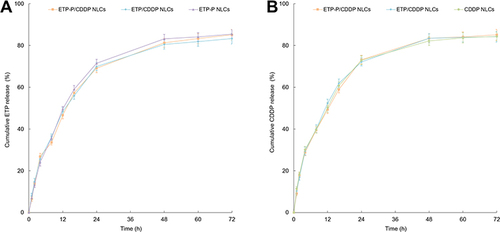
Figure 5 Cellular uptake efficiency of EtpP–CDDP NLCs, Etpp–CDDP NLCs, and blank NLCs. Uptake of NLCs was visualized using inversion fluorescence microscopy and quantified by fluorescence-activated cell sorting.
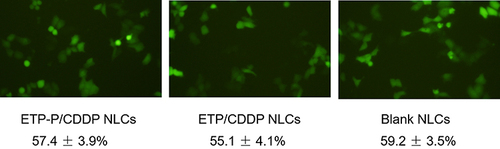
Figure 6 Cytotoxicity of drugs and drug-containing NLCs assessed by evaluating A549/DDP (A), BEAS-2B (B), and HUVECs (C) viability using MTT assays. A549/DDP and BEAS-2B cells (2×10⁴ cells/well) were seeded in 96-well plates and allowed to grow for 24 h, then were treated with EtpP–CDDP NLCs, Etpp–CDDP NLCs, EtpP NLCs, CDDP NLCs, blank NLCs, free EtpP–CDDP, free EtpP, and free CDDP at various drug concentrations. CI50 values illustrated the synergistic effect of the dual drug–containing systems (D). Caspase 3 activity assays were carried out according to the instructions of the manufacturer with a caspase 3 activity kit (E). *P<0.05.
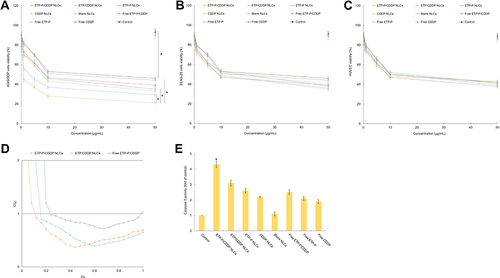
Figure 7 Etp (A) and CDDP (B) blood concentration–time profiles of EtpP–CDDP NLCs, Etpp–CDDP NLCs, and free EtpP–CDDP. Mixtures were vortexed and centrifuged (15,000 rpm, 10 min), and supernatants and plasma concentration of drugs were determined.
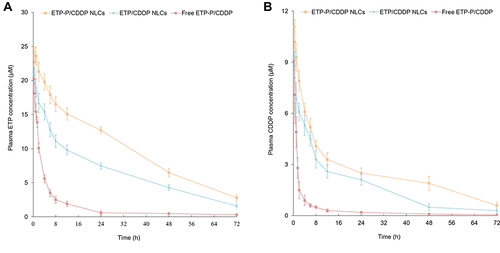
Figure 8 Tissue Etp (A) and CDDP (B) biodistribution of EtpP–CDDP NLCs, Etpp–CDDP NLCs, and free EtpP–CDDP. At 1 and 48 h, the tumor tissue and other main tissue types (heart, liver, spleen, lung, and kidney) were removed, washed, homogenized, and analyzed. *P<0.05.
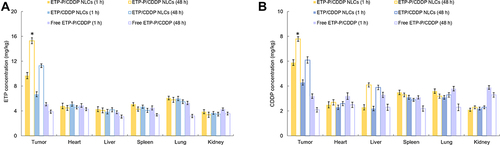
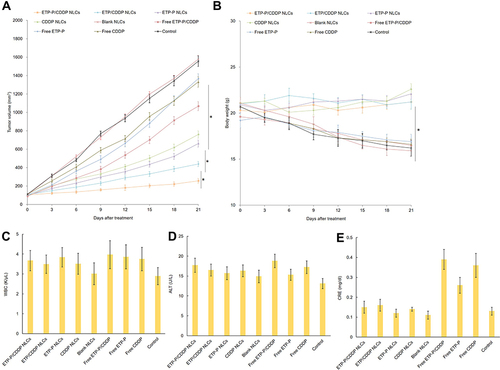
Figure 9 In vivo antitumor activity (A), body-weight changes (B), WBC (C), Alt (D), and Cre (E) in lung cancer–bearing mice. Tumor sizes were measured using calipers before every injection and tumor volume calculated by long axis × (short axis)2/2. Body-weight changes were monitored every 3 days to evaluate systemic toxicity. *P<0.05.