Figures & data
Figure 1 Cultivation and characterization of hPDLSCs. (A) hPDLSCs arranged in a swirling pattern after subculturation. Scale bar: 500μm. (B) Mineralized nodules formed after osteogenesis induction. Scale bars: 100μm. (C) Lipid droplets formed after lipogenesis induction. Scale bars: 100μm. The expression levels of CD90 (D), CD34 (E), and CD45 (F) were determined by flow cytometry.
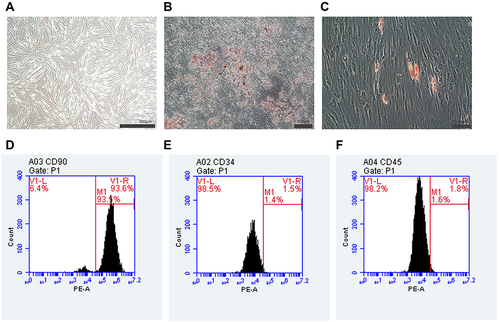
Figure 2 Influences of NG-R1 on hPDLSC proliferation. (A) Effects of different concentrations of NG-R1 on hPDLSCs. (B) Colonies formed by 20μmol group were larger and more numerous than other groups. (C) The rate of clonal formation increased considerably in the 20μmol group. (ANOVA, n = 3). The columns represent the means. Error bars represent standard deviations. (** P < 0.01 ****P < 0.0001).
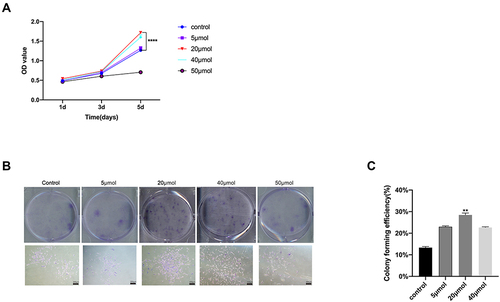
Figure 3 Effects of NG-R1 on ALP activity and mineralized nodule deposition of hPDLSCs(A) ALP activity under different concentrations of NG-R1 treatment (ANOVA, n = 3). (B)ALP staining under different concentrations of NG-R1 treatment. Scale bar: 100 μm.(C) Formation of mineralized nodules after alizarin red staining. Scale bar: 100μm. (D) Mineralized nodule formation was quantitatively analyzed at OD562 (ANOVA, n = 3). The columns represent the means. Error bars represent standard deviations. (***P < 0.001**** P < 0.0001).
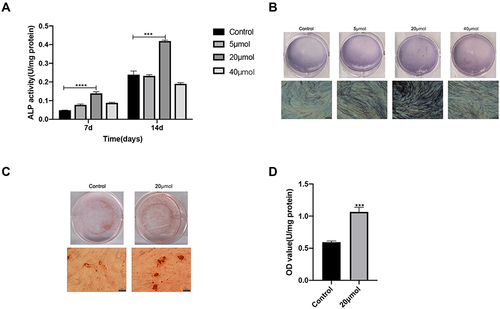
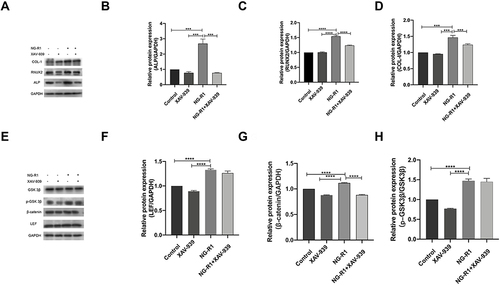
Figure 4 Expression of osteogenesis associated genes ALP (A), RUNX2 (B), COL-1 (C) and β-catenin (D)were all enhanced by 20μmol NG-R1 treated. (ANOVA, n = 3). Expression of osteogenesis associated genes detected by Western blot analysis were all enhanced by 20μmol NG-R1 treated (E and F) (ANOVA, n = 3). The columns represent the means. Error bars represent standard deviations. (*P < 0.05,***P < 0.001, ****P < 0.0001).
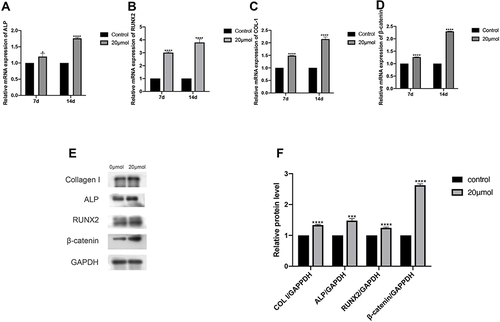
Figure 5 The effects of XAV-939 on NG-R1 treated osteogenic promotion of hPDLSCs. NG-R1 boosted osteogenesis and pathway-related genes expression substantially, whereas XAV-939 inhibited the expression of these genes. (A-H) (ANOVA, n = 3). The columns represent the means. Error bars represent standard deviations. (***P < 0.001, ****P < 0.0001).