Figures & data
Table 1 Primers Used for qPCR
Figure 1 Oridonin relieves HSK severity in mice models. (A) Cornea opacity and neovascularization changes were monitored after application with DMSO, Ori, ACV, combined Ori and ACV at 3dpi. (B) Corneal clinical scores (n=12 per time point) were calculated. (C) expression of il-1a, il-6 and tnf-α (n=6) were measured by qPCR at 3dpi. mrpl5 was used as the reference gene. (D) Histological evaluation. (*P < 0.05, **P < 0.01, ***P < 0.001, ****P < 0.0001, ns means no significance, compared with the control group with PBS and DMSO injection). P values were calculated with one-way ANOVA.
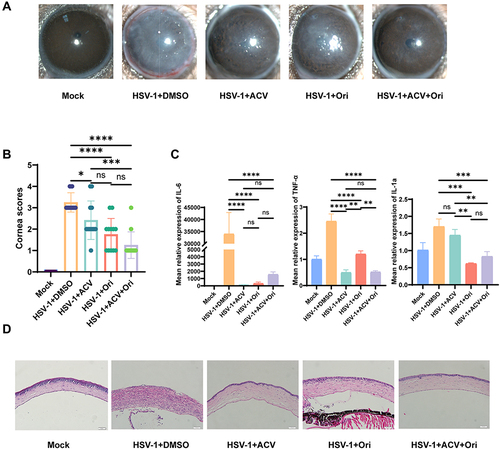
Figure 2 Ori inhibits HSV-1 virus replication in mouse models. (A) Tear titers (PFU/mL) obtained by TCID50 method at 3 dpi (n=6). (B) Representative immunostaining of corneal DAPI, HSV-1 ICP0 at 3dpi. (C) relative expression of TK, VP16, and ICP0 in cornea samples (n=6) were measured by qPCR. mrpl5 was used as the reference gene. (*P < 0.05, **P < 0.01, ***P < 0.001, **** P < 0.0001, ns means no significance, compared with the mock group with 0.1%DMSO peritoneal injection). P values were calculated with one-way ANOVA.
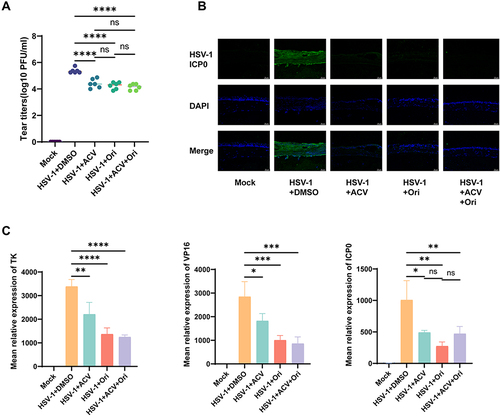
Figure 3 Ori disrupts on HSV-1 virus replication in vitro. (A) Cell viability of Ori in Vero cells. (B) Vero cells were infected with HSV-1-EGFP (MOI=1) for 2 h and then treated with various concentrations of Ori for 24h and 48h. For control experiments, a 0.1% DMSO solution was used. (C) The ratio of viral infection was quantified by EGFP fluorescence (n=6). (D) Plaque assays were performed and HSV-1 virus titers of each group (E) were calculated (n=6). (F) qPCR analysis of HSV-1 viral gene expression. Total RNA was isolated and subjected to qPCR analysis with the primers specific to HSV-1 TK, VP16, and ICP0 (n=3). Relative RNA expression was normalized to RPL5 in each sample. (* P < 0.05, ** P < 0.01, *** P < 0.001, **** P < 0.0001, ns means no significance). P values were calculated with one-way ANOVA.
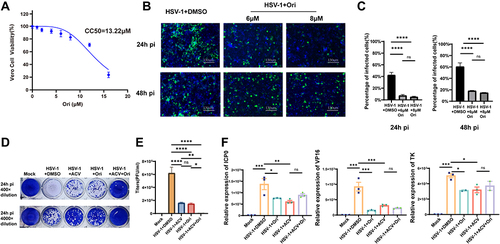
Figure 4 Ori inhibits on HSV-1 virus replication in vitro. (A) A schematic of different Ori treatments administered to HSV-1 and Vero cells. Ori treatment in different modes was used to study its effect on the stage of viral inactivation, penetration and attachment. (B) A schematic of different Ori treatments administered to HSV-1 and host cells. Ori treatment in different ways was used to study its effect on the pre-infection, coaddition, and the post-infection stage. (C–E) Ori treatment during viral inactivation, attachment and penetration in the early stage of the HSV-1 life cycle did not disrupt HSV-1 replication. Vero cells were treated with Ori (6 µM) as described in (A) and infected with HSV-1. The expression levels of intracellular HSV-1 VP16 were normalized to RPL5. (F) Ori treatment post infection repressed HSV-1 virus replication. Vero cells were treated with Ori (6 µM) as described in (B) and infected with HSV-1. The expression levels of intracellular HSV-1 VP16 were in each group normalized to RPL5. (****P < 0.0001, ns means no significance). P values were calculated with Student’s t-test.
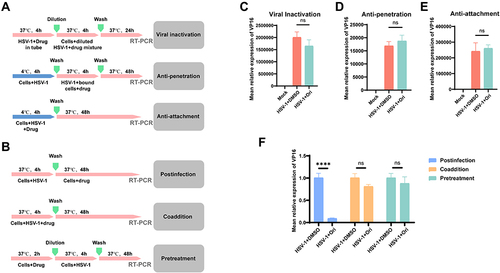
Figure 5 RNA sequencing analysis. (A) Venn graph. Co-expressed and uniquely expressed genes in Mock, HSV-1+DMSO and HSV-1+Ori group. (B) PCA plot Principal component analysis of Mock, HSV-1+DMSO and HSV-1+Ori samples. (C) Volcano Plot of DEGs in HSV-1+DMSO and HSV-1+Ori group. Red dots: upregulated genes with log2 FC > 3.32, and adjusted P < 0.05. The Green dots: downregulated genes with log2 FC < −3.32 and adjusted P < 0.05. FC, fold change; DEGs, differentially expressed genes. (D) Heatmap of genes enriched in the GO terms with the higher enrichment factor in HSV-1+DMSO and HSV-1+Ori group. The log10 FC values were used to generate heatmaps. Each row represents a gene in the figure. Red, high expression, and blue, low expression in the group, respectively. (E) GO enrichment analysis. GO analysis of target genes for biological processes revealed that downregulated genes were greatly enriched in immune response, angiogenesis, and inflammatory response.
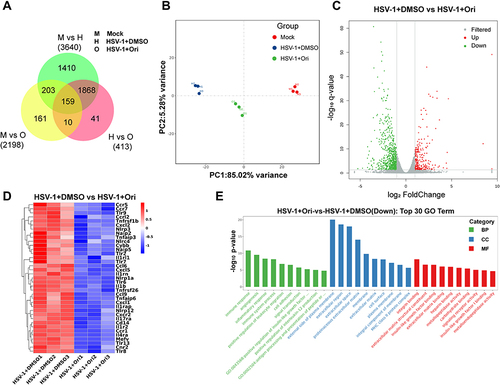
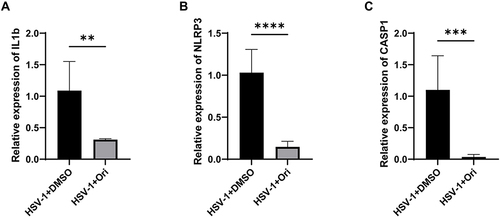
Figure 6 Ori relieving HSK in mice models via suppressing inflammasome. (A–C) The relative expressions of il-1β, casp1 and nlrp3 (n=3) in HSV-1 infected corneas from Mock (0.1%DMSO) or Ori treatment group. (** P < 0.01, *** P < 0.001, **** P < 0.0001, compared with Mock group). mrpl5 was used as the reference gene. P values were calculated with Student’s t-test.