Figures & data
Figure 1 Effect of Edaravone on the body weight and arthritis score of normal and CFA induced arthritis rats. (A): body weight and (B): arthritic score. The data are expressed as the mean ± standard error means (SEM) (n=10). Dunnett’s test was used for comparisons the data. Where *P<0.05, **P<0.01 and ***P<0.001 was considered as significant, more significant and extreme significant vs CFA control. ###P<0.001 consider as significant and compared with the normal control.
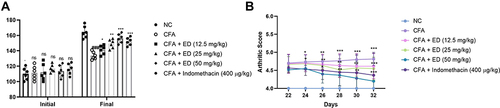
Figure 2 Effect of Edaravone on the spleen and thymus index of CFA induced arthritis rats. (A): Spleen index and (B): thymus index. The data are expressed as the mean ± standard error means (SEM) (n=10). Dunnett’s test was used for comparisons the data. Where *P<0.05, **P<0.01 and ***P<0.001 was considered as significant, more significant and extreme significant vs CFA control. ###P<0.001 consider as significant and compared with the normal control.
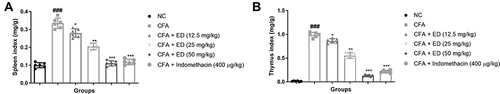
Table 1 Effect of Edaravone on Paw Swelling in CFA Induced Arthritis
Figure 3 Effect of Edaravone on the RF and CRP of CFA induced arthritis rats. (A): CRP and (B): RF. The data are expressed as the mean ± standard error means (SEM) (n=10). Dunnett’s test was used for comparisons the data. Where *P<0.05, **P<0.01 and ***P<0.001 was considered as significant, more significant and extreme significant vs CFA control. ###P<0.001 consider as significant and compared with the normal control.
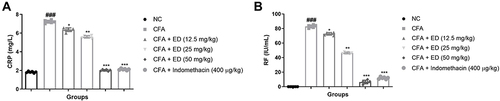
Figure 4 Effect of Edaravone on the haematological parameters of CFA induced arthritis rats. The data are expressed as the mean ± standard error means (SEM) (n=10). Dunnett’s test was used for comparisons the data. Where *P<0.05, **P<0.01 and ***P<0.001 was considered as significant, more significant and extreme significant vs CFA control. ###P<0.001 consider as significant and compared with the normal control.
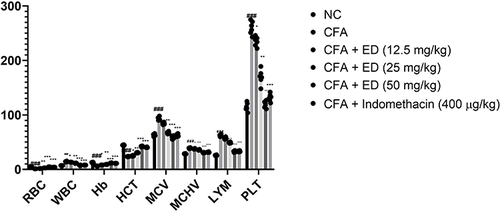
Figure 5 Effect of Edaravone on the antioxidant parameters of CFA induced arthritis rats. The data are expressed as the mean ± standard error means (SEM) (n=10). Dunnett’s test was used for comparisons the data. Where *P<0.05, **P<0.01 and ***P<0.001 was considered as significant, more significant and extreme significant vs CFA control. ###P<0.001 consider as significant and compared with the normal control.
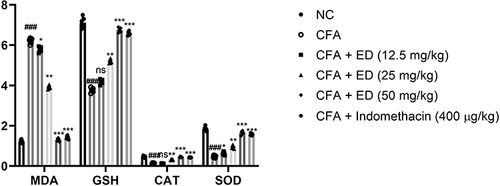
Figure 6 Effect of Edaravone on the serum nitrate and total protein parameter of CFA induced arthritis rats. (A): total protein and (B): serum nitrate. The data are expressed as the mean ± standard error means (SEM) (n, 10). Dunnett’s test was used for comparisons the data. Where *P<0.05; **P<0.01 and ***P<0.001 was considered as significant; more significant and extreme significant vs CFA control. ###P<0.001 consider as significant and compared with the normal control.
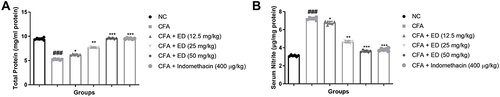
Figure 7 Effect of Edaravone on the hepatic parameters of CFA induced arthritis rats. The data are expressed as the mean ± standard error means (SEM) (n, 10). Dunnett’s test was used for comparisons the data. Where *P<0.05; **P<0.01 and ***P<0.001 was considered as significant; more significant and extreme significant vs CFA control. ###P<0.001 consider as significant and compared with the normal control.
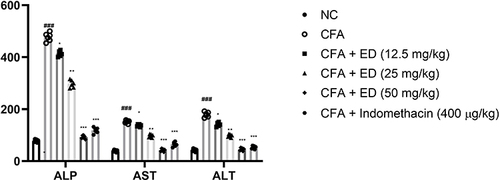
Figure 8 Effect of Edaravone on the pro-inflammatory parameters of CFA induced arthritis rats. The data are expressed as the mean ± standard error means (SEM) (n, 10). Dunnett’s test was used for comparisons the data. Where *P<0.05; **P<0.01 and ***P<0.001 was considered as significant; more significant and extreme significant vs CFA control. ###P<0.001 consider as significant and compared with the normal control.
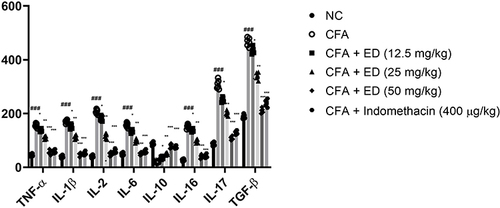
Figure 9 Effect of Edaravone on the inflammatory parameters of CFA induced arthritis rats. (A): COX-2; (B): PGE2 and (C): NF-κB. The data are expressed as the mean ± standard error means (SEM) (n, 10). Dunnett’s test was used for comparisons the data. Where *P<0.05; **P<0.01 and ***P<0.001 was considered as significant; more significant and extreme significant vs CFA control. ###P<0.001 consider as significant and compared with the normal control.
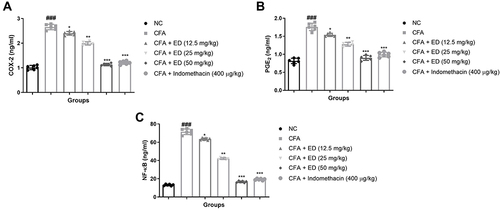
Figure 10 Effect of Edaravone on the angiogenesis parameters of CFA-induced arthritis rats. (A): HIF-1α; (B): VEGF and (C): ANG-1. The data are expressed as the mean ± standard error means (SEM) (n, 10). Dunnett’s test was used for comparisons the data. Where *P<0.05; **P<0.01 and ***P<0.001 was considered as significant; more significant and extreme significant vs CFA control. ###P<0.001 consider as significant and compared with the normal control.
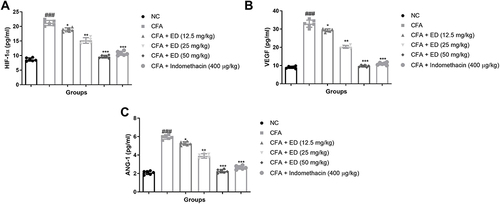
Figure 11 Effect of Edaravone on the cell viability. (A): cell viability on osteoclast cells and (B): TRAP level. Data were presented as the mean ± SD of experiments. Where *P<0.05 and **P<0.01 compared with control group.
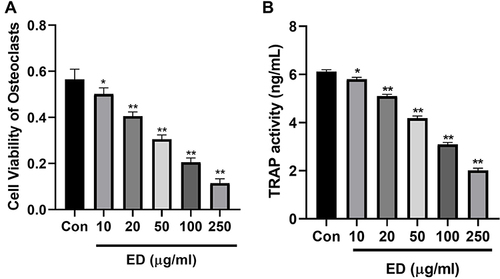
Figure 12 Effect of Edaravone on the level of cytokines. (A): TNF-α; (B): IL-1; (C): IL-6 and (D): IL-37. Data were presented as the mean ± SD of experiments. Where *P<0.05 and **P<0.01 compared with control group.
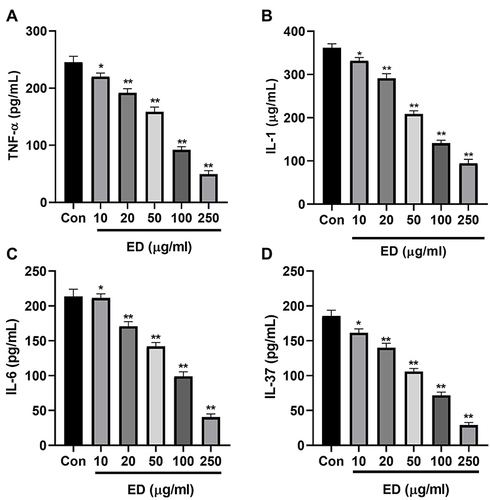
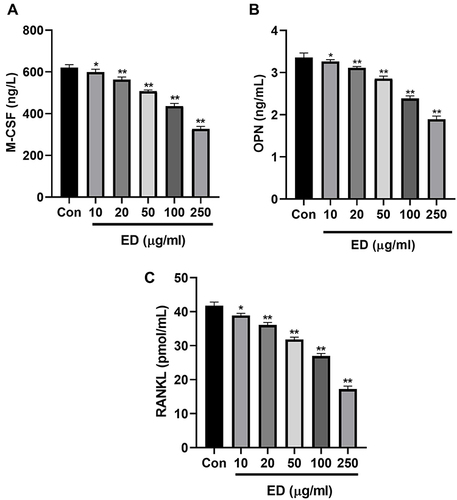
Figure 13 Effect of Edaravone on the level of OPN; M-CSF and RANKL. (A): OPN; (B): M-CSF and (C): RANKL. Data were presented as the mean ± SD of experiments. Where *P<0.05 and **P<0.01 compared with control group.