Figures & data
Figure 1 Chemical structure of gliclazide.
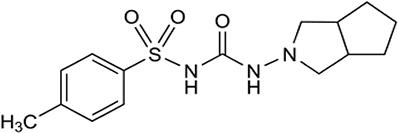
Table 1 Drug/ Polymer Composition and Concentration in the Different Formulations of GZ Mucoadhesive Films
Table 2 Different Physicochemical Parameters of the GZ Bucco-Adhesive Films
Figure 2 SEM image of plain buccal film (A) and drug loaded film (F10) (B).
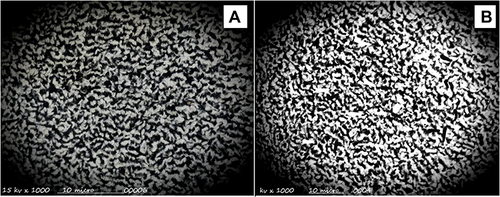
Figure 3 DSC thermogram for (A) gliclazide, (B) gelatin, (C) chitosan, and (D) carbopol.
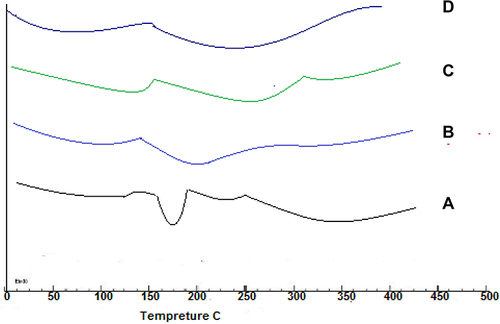
Figure 4 FTIR spectrum of GZ (A), and mixture blend of F10 components (B).
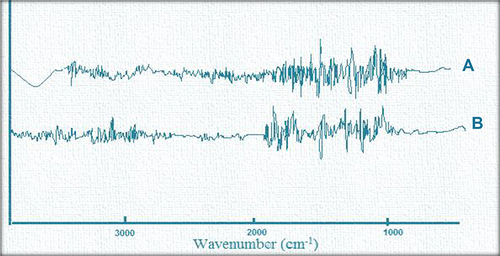
Figure 5 Film’s folding endurance for formulations F1-F16.
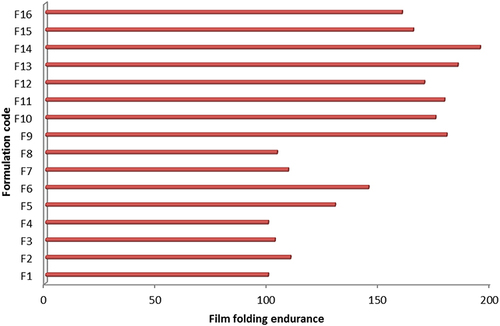
Figure 6 (A–D) Swelling behavior of GZ buccal batch films in phosphate buffer.
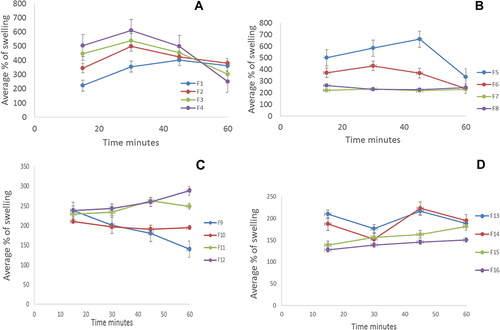
Figure 7 Mucoadhesion force for the selected GZ buccal batch films.
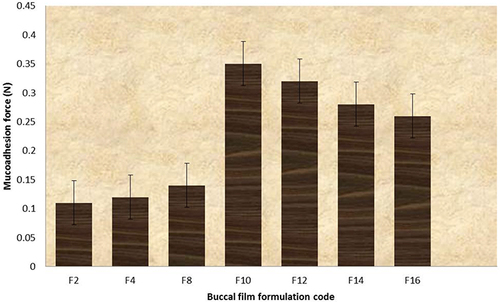
Figure 8 Release profile of GZ from selected buccal films (F2, F4, F8, F10, F12, F14 and F16) in 0.1N HCl buffer for 2 hours.
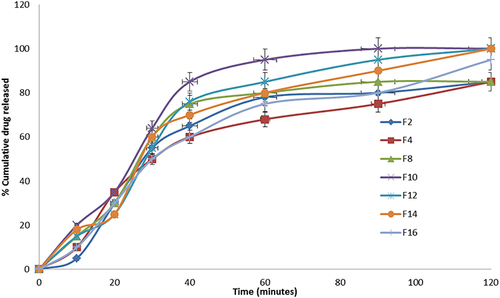
Table 3 Stability of Selected GZ Films (F10, F12, F14) in Term of Folding Endurance, Moisture Content, Drug Content and Muco-Adhesion Strength at 4°C, 25°C, and 40°C After 90 Days
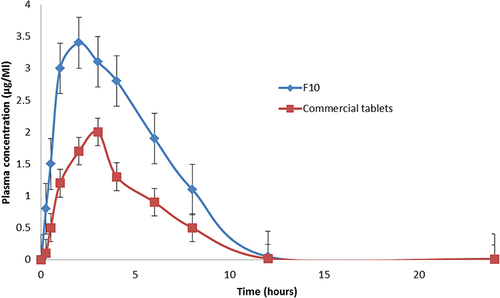
Table 4 Mean Pharmacokinetic Parameters of GZ After Buccal Use of F10, and Oral Administration of Commercial Tablets to Rabbits
Figure 9 GZ plasma concentration (mean ± S.E) time profiles in rabbits after administration of buccal film (F10) and commercial tablets.