Figures & data
Figure 1 Schematic of the network pharmacological analysis used to identify the potential mechanism of BLEC action on CAD.
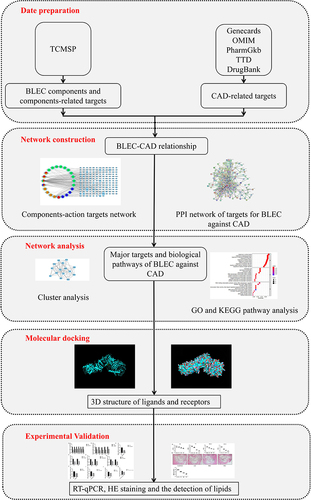
Figure 2 Identification of the CAD-related genes by taking a union of all the results from 5 database.
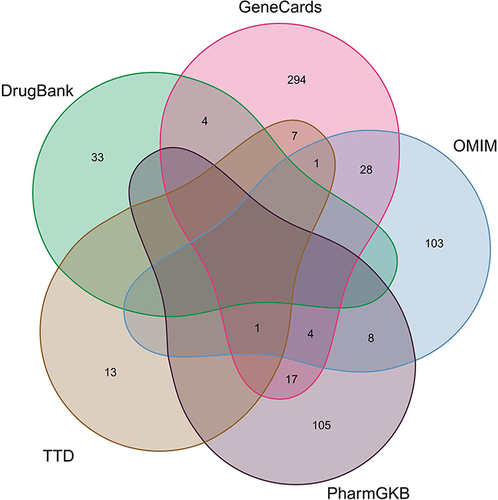
Figure 3 Identification of the drug-target disease-related genes by taking an intersection of drug target genes and CAD-related genes.
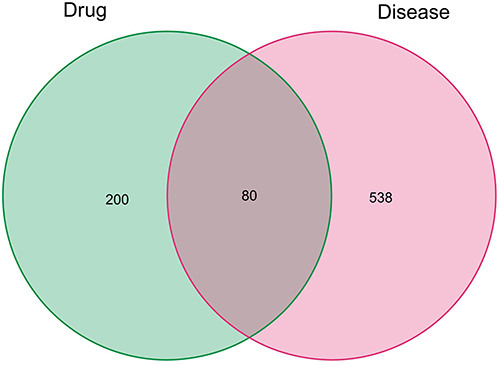
Table 1 Active Ingredients of BLEC in the Treatment of CAD
Figure 4 Construction of the drug-target pharmacology network. The drug-targets interaction pharmacology network. Circles represent the small molecule active compounds in BLEC. Each colour represents a traditional Chinese medicine ingredient. Rectangle represents the CAD-related target genes, and edges represent the interaction between the small molecule compounds and the target genes.
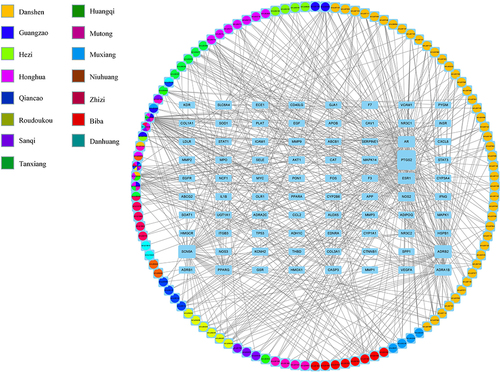
Figure 5 Protein–Protein interaction (PPI) network.
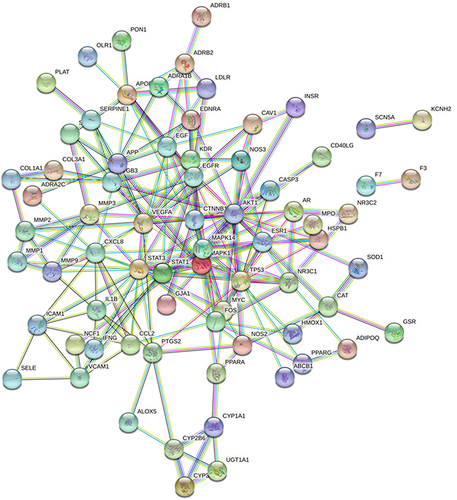
Figure 6 Identification of key subnetwork using Cytoscape. PPI network and the first filtration by CytoNca, the yellow nodes were screened with each score higher than median. Subnetwork constructed by a second filtration via CytoNca. The yellow nodes were screened with a score higher than the median. Final key subnetwork screened after two filtrations using CytoNca. Key subnetwork of top 9 nodes analysed by CytoHubba.
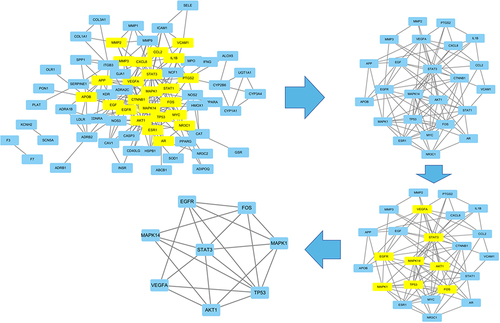
Figure 7 The top 10 of GO enrichment analysis.
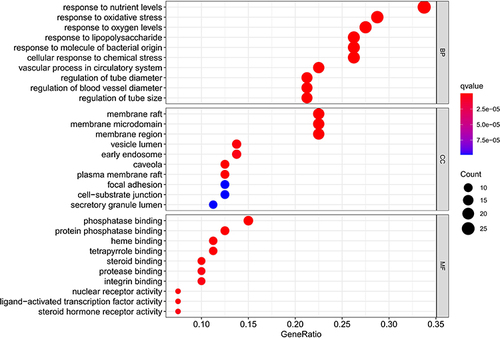
Figure 8 KEGG enrichment analysis and pathway map. (A) KEGG enrichment analysis of the target genes. Gene ratio refers to the ratio of enriched genes to all target genes. Counts refer to the number of the enriched genes. (B) Pathway map of fluid shear stress and atherosclerosis as the most significant enriched pathway.
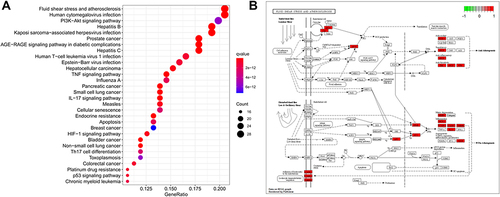
Table 2 Molecular Docking Score
Figure 9 Screening of the key genes in the subnetwork and further molecular docking. (A) Molecular docking between the six small molecule ligands and protein 5WBL (encoded by AKT1). (B) Molecular docking between the two small molecule ligands and protein 2RGP (encoded by EGFR). (C) Molecular docking between the four small molecule ligands and protein 1FOS (encoded by FOS). (D) Molecular docking between the three small molecule ligands and protein 3W55 (encoded by MAPK1). (E) Molecular docking between the one small molecule ligands and protein 6NUQ (encoded by STAT3). (F) Molecular docking between the eight small molecule ligands and protein 3L8X (encoded by MAPK14). (G) Molecular docking between the five small molecule ligands and protein 2VPF (encoded by VEGFA). (H) Molecular docking between the six small molecule ligands and protein 7BWN (encoded by TP53).
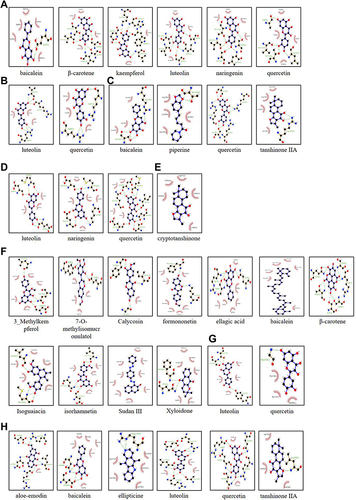
Figure 10 Effects of active compounds of BLEC on core target gene expression in RAW264.7 cells. (A) The relative mRNA expression level of akt1, egfr, fos, mapk1, tp53, vegfa in RAW264.7 cells with PBS or quercetin. (B) The relative mRNA expression level of akt1, egfr, mapk1, tp53, vegfa in RAW264.7 cells with PBS or luteolin. (C) The relative mRNA expression level of akt1 in RAW264.7 cells with PBS or kaempferol. (D) The relative mRNA expression level of akt1 and mapk1 in RAW264.7 cells with PBS or naringenin. (E) The relative mRNA expression level of fos and tp53 in RAW264.7 cells with PBS or tanshinone IIA. (F) The relative mRNA expression level of akt1 and vegfa in RAW264.7 cells with PBS or β-carotene. (G) The relative mRNA expression level of mapk14 in RAW264.7 cells with PBS or 7-O-methylisomucronulatol. (H) The relative mRNA expression level of fos in RAW264.7 cells with PBS or piperine. (I) The relative mRNA expression level of mapk14 in RAW264.7 cells with PBS or isorhamnetin. (J) The relative mRNA expression level of mapk14 in RAW264.7 cells with PBS or Xyloidone. N=6. Data are shown as means±SD. *p < 0.05 vs. The control group.
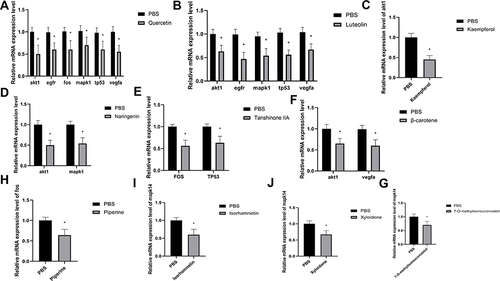
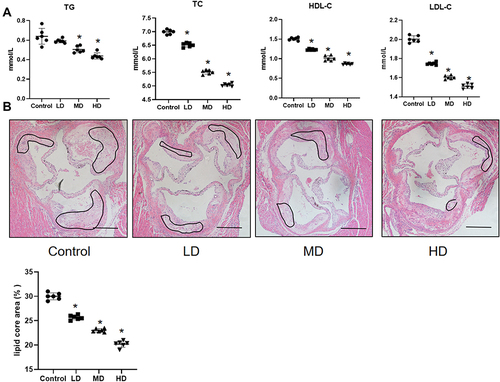
Figure 11 BLEC attenuates the development of atherosclerosis and decreases TC, TG, LDL-C and HDL-C in vivo. (A) The serum lipid levels in ApoE−/− mice treatment with LD, MD and HD BLEC and fed an HFD for 12 weeks was analyzed. (B) Hematoxylin and eosin (H&E)-stained cross-sections of aortic root tissue from ApoE−/− mice treatment with LD, MD and HD BLEC and fed an HFD for 12 weeks (magnification, 10×). The circular region indicates the necrotic core area. Necrotic core areas were defined as anuclear, antifibrotic, and eosin-negative areas. Scale bar = 200 μm. All data are expressed as the mean ± SD. *P < 0.05 vs The control group.