Figures & data
Figure 1 The inhibition mechanism of Cec4 against A. baumannii in vitro. (A) FITC-labelled Cec4 colocalized with the cell membrane of A. baumannii. Cec4 labelled by FITC (green) colocalizes cell membranes labelled by DiI (red) and bacterial DNA labelled by DAPI (blue). (B) The effect of Cec4 in enhanced bacterial cell permeability. With the increase of Cec4 concentration, the increase of PI fluorescence intensity indicated the increase of bacterial cell membrane permeability. (C) After Cec4 treatment, the cell membrane of A. baumannii was depolarized. The probe was aggregated and quenched in the normal cell membrane. With the increase of Cec4 treatment concentration, the fluorescence of the probe was enhanced, indicating that the bacterial cell membrane potential was depolarized. (D) The intracellular reactive oxygen species of A. baumannii increased after Cec4 treatment. When the dye enters the cell, it is oxidized and then fluoresces. With the increase of Cec4 concentration, fluorescence enhancement indicated the increase of intracellular ROS. Results were presented as mean ± SD. **P < 0.01, ***P < 0.001.
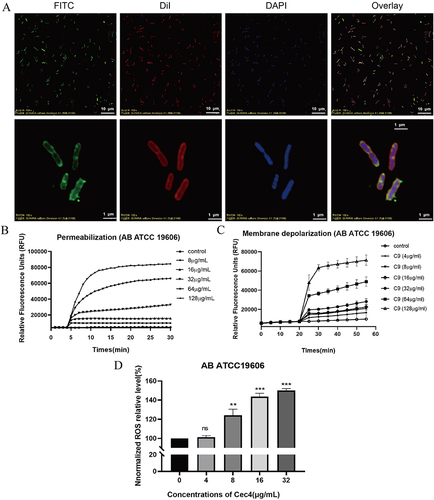
Table 1 Some Differential Genes Before and After Cec4 Treatment
Figure 2 The transcriptome analysis of A. baumannii inhibited by Cec4. (A) The volcanic map of A. baumannii differential gene before and after treatment with subinhibitory concentration Cec4. (B) The differential gene expression heat map in different groups. After standardization, green indicated down-regulated gene, while red indicated up-regulated gene. (C) The results of DEGs’ GO enrichment analysis. The size of bubble represents the number of genes enriched in this Term, and the color of bubble represents the enriched padj value. (D) The results of DEGs’ KEGG enrichment analysis. The size of bubble represents the number of genes enriched in this pathway, and the color of bubble represents the enriched padj value.
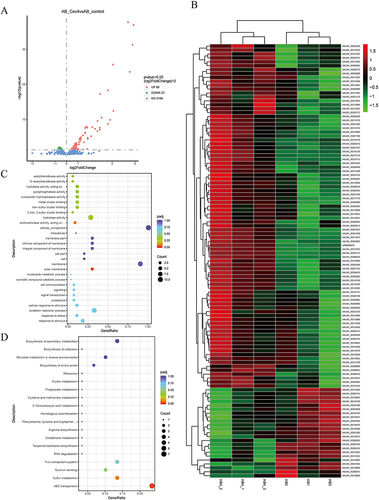
Table 2 Some Differential Genes Between C-7 and ATCC19606
Figure 3 Transcriptome sequencing analysis of C-7 resistant strain and ATCC19606. (A) The passaged MIC of ATCC19606 under Cec4 induction. X axis is the number of passages, and Y axis is the corresponding MIC value. (B) The expression pattern of differential genes in C-7 (7th generation induced strain) and ATCC19606. Red is the up-regulated gene and blue is the down-regulated gene. (C) The DEGs volcano map of C-7 and ATCC19606. (D) The DEGs’ GO enrichment analysis of C-7 and ATCC19606. (E) The DEGs’ KEGG enrichment analysis of C-7 and ATCC19606. The size of bubble represents the number of genes enriched in this pathway, and the color of bubble represents the q-value of enrichment.
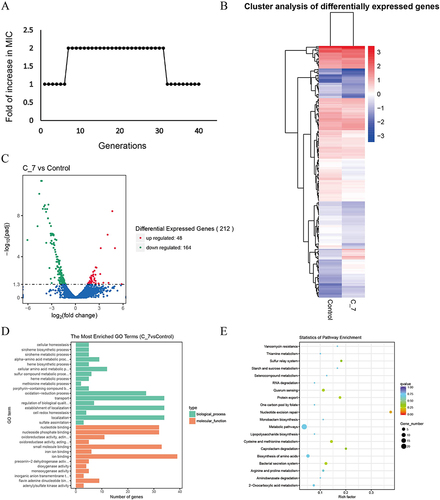
Figure 4 Acute toxicity of Cec4 to mammalian cells and C. elegans. (A) Effect of Cec4 on proliferation of HeLa cells and HepG2 cells. X axis shows different cell lines, Y axis indicates CCK-8 colorimetric results. (B) Effects of Cec4 and erythromycin on survival rate of C. elegans. The X-axis is observation days after treatment with erythromycin and Cec4, and the Y-axis is survival rate. Compared with erythromycin, the survival rate of C. elegans treated with Cec4 was much higher. Results were presented as mean ± SD. *P < 0.05.
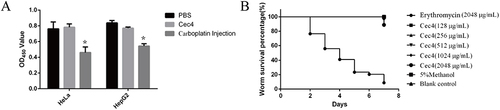
Figure 5 Acute toxicity assessment of Cec4 in mice. (A) Histopathological observation of liver tissues of mice injected with normal saline. Black arrows indicate steatosis of hepatocytes (A1 and A2 are different fields of view in the same slice, the same applies below). (B) Histopathological observation of liver tissue of mice injected with Cec4. Black arrows indicate loose hepatocyte cytoplasm, yellow arrows indicate focal infiltration of a few lymphocytes, red arrows indicate bile duct hyperplasia, blue arrows indicate connective tissue hyperplasia, and green arrows indicate hemosiderin exudation. (C) Histopathological observation of renal tissue of mice injected with normal saline. (D) Histopathological observation of renal tissue in mice injected with Cec4, the black arrow indicates eosinophilic material in the renal vesicles. (E) Blood biochemical assays of mouse for C9 (45 mg/kg) treated 24 h. Serum levels of lactate dehydrogenase (LDH), alanine aminotransferase (ALT), aspartate aminotransferase (AST), albumin (ALB), and serum creatinine (Cr) were determined. Data are presented as mean ± SD (n = 6) and the statistical analysis was assayed by the independent Student’s t test (P > 0.05).
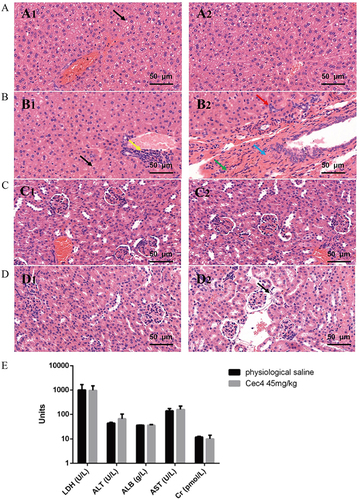
Figure 6 Cec4 is effective in the treatment of clinical multidrug-resistant A. baumannii infections. (A) Survival curves after Cec4 treatment of C. elegans infected with A. baumannii. (B) Bacterial load count of C. elegans infected with A. baumannii after Cec4 treatment. (C) Infection model of skin wound on mouse back. (D) Bacterial load count of A. baumannii after Cec4 treatment of mice with back skin infection (bacterial load per gram of skin). (E) Survival curves of mice infected with A. baumannii after Cec4 treatment. (F) Bacterial load count of mice infected with A. baumannii after Cec4 treatment. Results were presented as mean ± SD. *P < 0.05, **P < 0.01, ***P < 0.001.
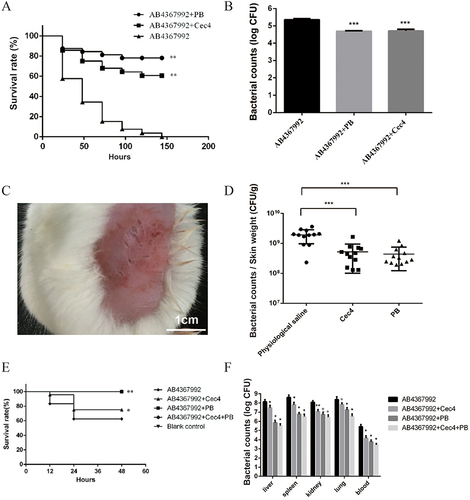
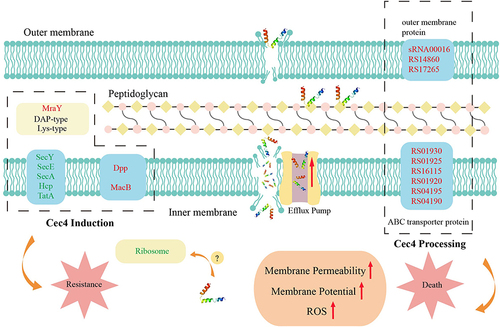
Figure 7 Mechanism of the death and resistance of A. baumannii after Cec4 treatment. Red font indicates up-regulated genes, green font indicates down-regulated genes, and red arrow indicates enhanced effects. The dashed boxes on the left are the differentially expressed genes of induced strain C-7 and ATCC19606. The dashed box on the right shows the differentially related genes after Cec4 treatment of ATCC19606.