Figures & data
Table 1 Formulations Protocol for Microsphere and Nanoparticles
Figure 1 Schematic diagram of drug permeation–pharmacodynamics correlation. Using this schematic diagram, a simple correlation between in vitro pharmacokinetic and in vivo pharmacodynamic study had been tried in this research.
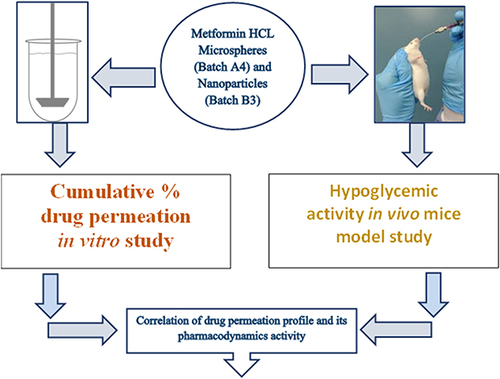
Table 2 The Effects of Polymeric Concentration, Drug Loading in Total Drug-Polymer Amount on Particle Size
Figure 2 Z-average (nm) value and PDI of Metformin microspheres of batch (a) A1, (b) A2, (c) A3 and (d) A4 and nanoparticles of batch (e) B1, (f) B2, (g) B3 and (h) B4.
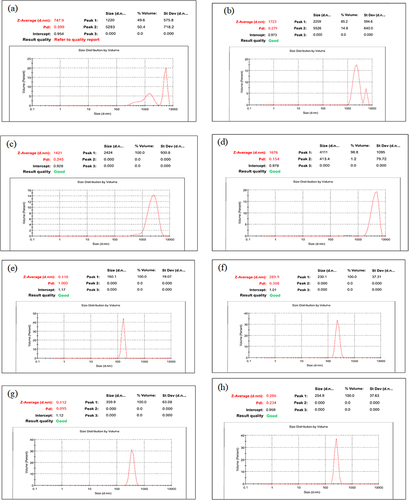
Figure 3 SEM images of metformin microspheres of batch (a) A1, (b) A2, (c) A3 and (d) A4, and nanoparticles of batch (e) B1, (f) B2, (g) B3 and (h) B4.
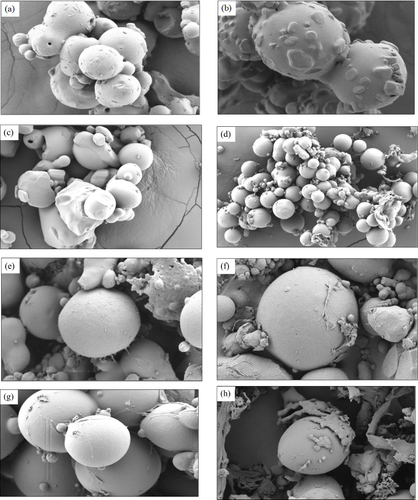
Figure 4 DSC thermogram of all batches of Metformin HCl loaded microspheres (a) and nanoparticles (b) in relation to pure Metformin HCl corresponding to the solid red line in both images. (a) Four batches of microspheres (A1, A2, A3 and A4 designated by solid purple, green, blue and black line respectively) and (b) four batches of nanoparticles (B1, B2, B3 and B4 designated by solid green, black, purple and blue line respectively).
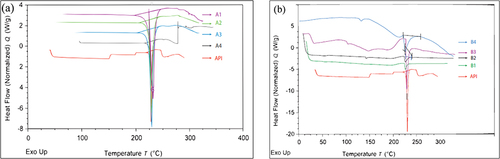
Table 3 FTIR Vibrational Band Assignment of Pure Metformin HCl API
Figure 5 FTIR spectrum of pure metformin HCl powder corresponding to the solid green line (a), all batches metformin HCl loaded microspheres (b) and nanoparticles (c). Four batches of microspheres (A1, A2, A3 and A4 designated by solid Orange, blue, green and purple line respectively) and four batches of nanoparticles (B1, B2, B3 and B4 designated by solid purple, pink, red and green line respectively).
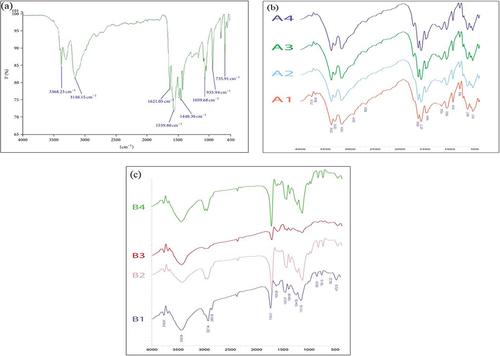
Table 4 Calculation of Drug Loading for Metformin HCl Microspheres and Nanoparticles
Figure 6 Comparison of cumulative % release in pH 6.8 phosphate buffer of metformin HCl from microspheres and nanoparticles prepared by emulsion solvent evaporation and nanoprecipitation technique respectively, where four formulations of metformin HCl loaded microspheres and nanoparticles indicated to (a and e) for zero order release profile, (b and f) for first order release profile, (c and g) for the Higuchi model and (d and h) for the Korsmeyer–Peppas model respectively. For all microsphere drug release figures (a-d), solid blue, Orange, ash and black line indicates microsphere batch A1, A2, A3 and A4 respectively whereas for all nanoparticles drug release figures (e-h), solid purple, red, yellow and green line indicates nanoparticle batch B1, B2, B3 and B4 respectively.
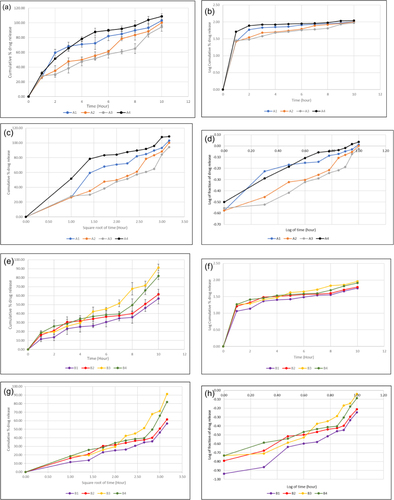
Table 5 Summary of Mathematical Kinetics Test of Prepared Formulations
Table 6 Best Fitted Models for Optimized Formulations
Figure 7 Permeability profiles of metformin HCl API powder (MAPI) indicated by solid red line, selected formulation A4 of microspheres (A4MS) indicated by solid blue line and B3 of nanoparticles (B3NP) indicated by solid green line (n = 3).
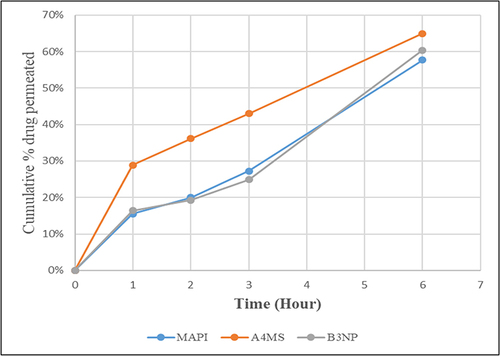
Figure 8 The apparent permeability, Papp (cm/s x 10–5) of metformin (mucosal -to- serosal) from metformin HCl API powder (MAPI), selected formulation A4 of microspheres (A4MS) and B3 of nanoparticles (B3NP) (n = 3).
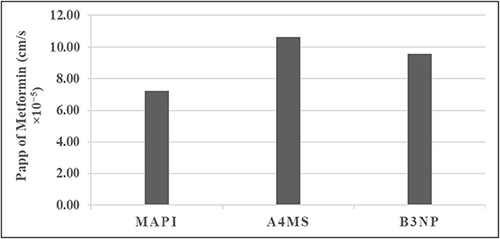
Table 7 Effect of Metformin HCl API Powder (MAPI), Selected Formulation A4 of Microspheres (A4MS) and B3 of Nanoparticles (B3NP) on Blood Sugar Level in Mice Model
Figure 9 Point to point correlation between the in-vitro pharmacokinetic (drug permeation profiles) and its in-vivo pharmacodynamic effect (Blood glucose reduction) of metformin HCl API (MAPI), metformin HCl loaded microsphere (A4MS) and nanoparticles (B3NP) whereas, Cumulative % drug permeation is indicated by blue points and reduction of Blood glucose concentration is indicated by Orange points.
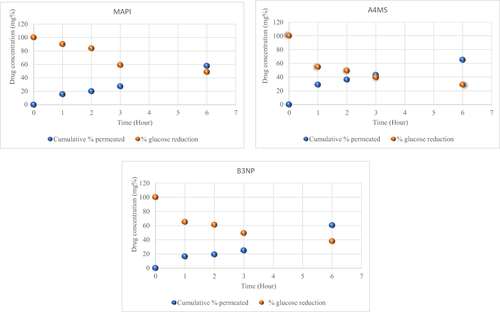
Figure 10 Correlation of the pharmacokinetic (drug permeation profiles) and its pharmacodynamic (hypoglycemic activity) effect: metformin HCl API (MAPI), metformin HCl loaded microsphere (A4MS) and nanoparticles (B3NP).
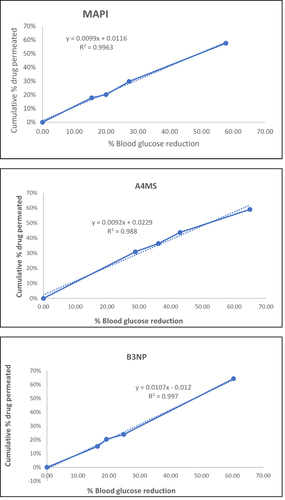
Table 8 Effect of Metformin HCl Nanoparticles on Cancerous HeLa Cell Line
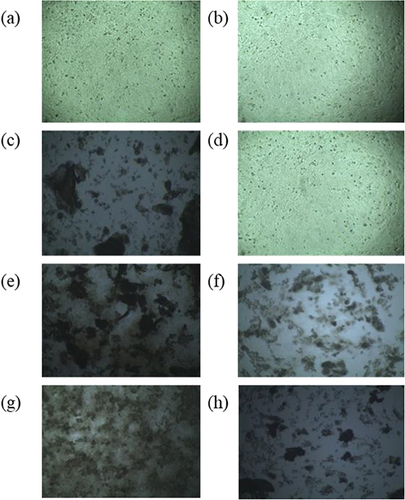
Figure 11 Effect of Metformin HCl Nanoparticles on cancerous HeLa cell line. HeLa cells were cultured with different samples, such as without solvent(a) or with solvent (b), 500 µg/mL concentration of B2, B3, and B4 formulations marked as B2A (c), B3A (e) and B4A (g), respectively and 250 µg/mL concentration of B2, B3, and B4 formulations named as B2B (d), B3B (f) and B4B (h), respectively of metformin loaded nanoparticles.