
Figures & data
Figure 1 Identification of chemical components of TXYF decoction by LC-MS. (A) TXYF chemical composition identification total ion flow diagram. (B) Structural spectrogram information of Naringenin and Nobiletin compounds. (C) Main information on the top 20 compounds with TXYF-Area. (D) The results in Figure (C) are further analyzed using Cytoscape software (Versions 7.2) and arranged in Dgree circle sizes.
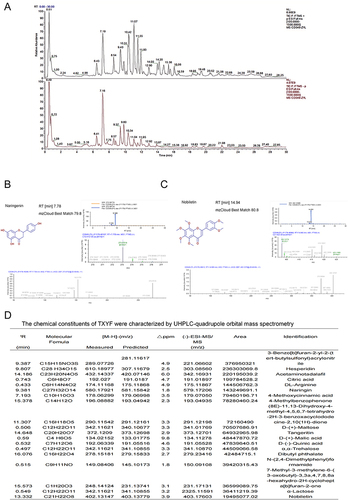
Figure 2 Network pharmacology analysis for TXYF. (A) herbal-ingredient-target relationship diagram. (B) Venn for TXYF targets and target of IBS from all databases. (C) Figure (E) Result Input STRING to draw the PPI network; (D) Figure (F) Results in Cytoscape analysis. (E) cytoHub and MODCE analysis. (F) KEGG analysis. (G) GO analysis. (H) Venn for IBS-target from different databases and TXYF targets. (I) PPI and cytoHub analysis for CHRM3. (J) CHRM3 for GO analysis. (K) KEGG analysis for CHRM3. Color depth is positively correlated with correlation, circle size is positively correlated with enrichment quantity.
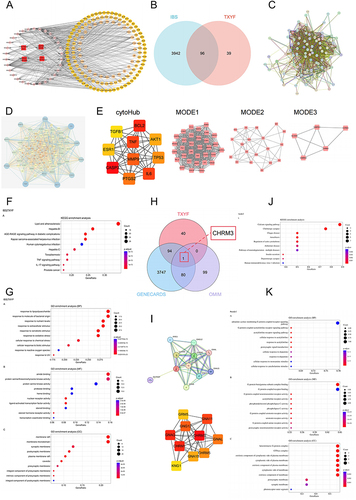
Figure 3 Molecular docking verification. (A) The five active components of TXYF are molecularly docked with CHRM3. (B) Visualization of connection between Naringenin and CHRM3. (C) Five active components of TXYF are connected with cytoHub target molecules. (D and E) Naringenin and Nebiletin perform docking visualizations with targets scoring less than −7.2. The different types of interactions and binding modes generated by the docking were represented by dashed lines of various colors. Conventional hydrogen bonding was denoted by green dashed lines, π-σ interactions by blue-purple dashed lines, π-Alkyl interactions by light pink dashed lines, hydrophobic interactions by light green dashed lines, and π-sulfur interactions by yellow dashed lines.
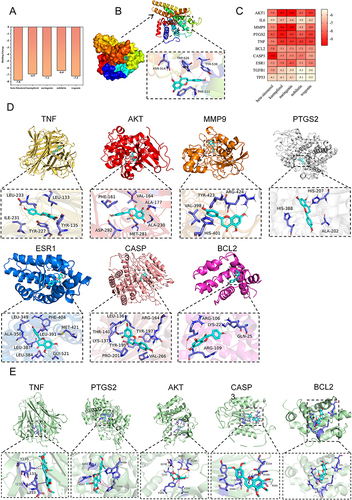
Figure 4 Verify cytoHub targets in vivo. (A) Schematic illustrations of experimental protocols. (B) Changes of body weight of mice in each group (N = 8). (C) Fecal water content in each group (N = 8). (D) AWR scores at a pressure stimulation of 0.25 mL/0.35 mL/0.5 mL (N = 8). (E) Changes of protein expression of cytoHub target in colon tissue of mice in each group (N = 8). (F) Figure E was quantified in gray scale (N = 8). (G) Colon HE staining of mice in each group (N = 6). Values were means±SD. N.S. = P > 0.05 Control vs IBS/IBS+TXYF or IBS vs IBS+TXYF; *P < 0.05, **P < 0.01, ***P < 0.001 Control vs IBS/IBS+TXYF; #P < 0.05, ##P < 0.01, ###P < 0.001 IBS vs IBS+TXYF. N represents the number of mice selected, and one mouse represents one repeat.
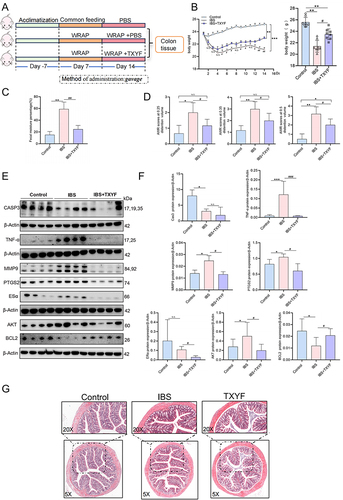
Figure 5 The expression of CHRM3 and Gq/PLC/MLCK in colon of each group. (A) The IHC results of CHRM3 in the colon show that the arrow points to areas with high CHRM3 expression, and the dark brown stain shows positive CHRM3 expression (N = 6). (B) WB verified the expression of CHRM3 in colon tissue of each group of mice (N = 8). (C) The expression of Ach in colon tissue of each group by ELISA (N = 6). (D) The expression of Ach in serum tissues of each group by ELISA (N = 6). (E and F) The expressions of Gq, G11 and MLCK were verified by WB (N = 8). (G) The expression of MLCK in colon of each group was verified by ELISA (N = 6). (H) The expression of PLC in colon of each group was verified by ELISA (N = 6). Values were means±SD. N.S. = P > 0.05 Control vs IBS/IBS+TXYF or Control vs IBS/IBS+TXYF; *P < 0.05, **P < 0.01, ***P < 0.001 Control vs IBS/IBS+TXYF; #P < 0.05, ##P < 0.01, ###P < 0.001 IBS vs IBS+TXYF. N represents the number of mice selected, and one mouse represents one repeat.
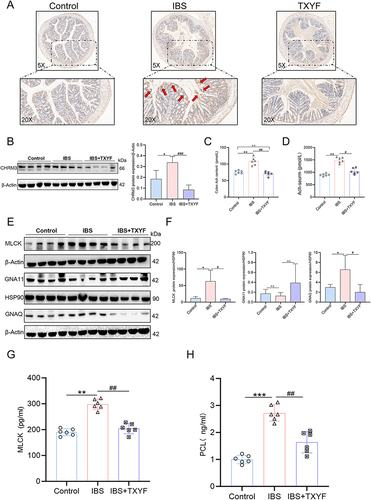
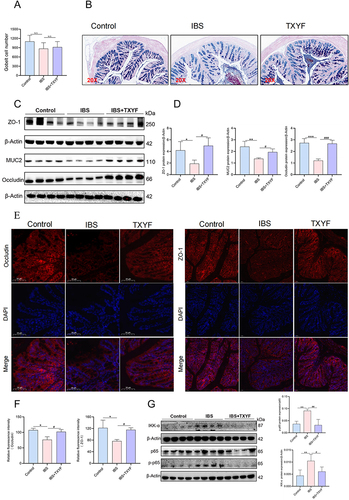
Figure 6 TXYF protects the gut barrier. (A) Goblet cell count (N = 6). (B) Typical representation of goblet cell secretion detected by AB-PAS staining (N = 6). Purple blue was neutral mucin and various glycoproteins, light blue was acidic mucin. (C and D) Changes in the expression of MUC2 protein associated with goblet cells and tight junction (TJ) related proteins ZO-1 and Occludin in each group (N = 8). (E and F) Changes of fluorescence expression of ZO-1 and Occludin in each group (N = 6). (G) Changes in expression of NF-κB signaling pathway related proteins in each group (N = 8). *P < 0.05, **P < 0.01, ***P < 0.001 Control vs IBS; #P < 0.05, ##P < 0.01, ###P < 0.001 IBS vs IBS+TXYF. N represents the number of mice selected, and one mouse represents one repeat.
Data Sharing Statement
All the data involved in this study are available in this published article.