Figures & data
Table 1 Composition of QTF
Table 2 The Sequences of Primers are Shown in Here
Table 3 Chemical Characterization of Bioactive Compounds in QTF
Figure 1 Analysis of QTF components by UPLC-MS. (A and B) The total ion chromatograms of QTF in (A) positive ESI mode and (B) negative ESI mode.
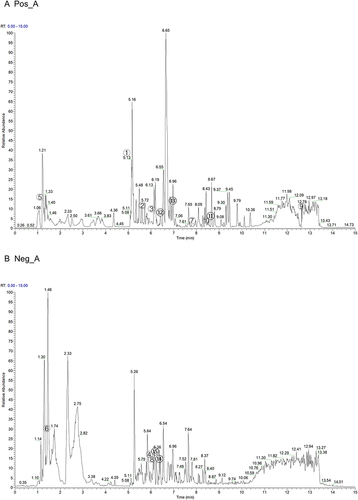
Table 4 Top 2 Compounds Information of QTF Network
Table 5 Top 4 Targets Information of PPI Network
Figure 2 QTF’s active ingredient-target interactions and their relevance to intestinal fibrosis-related targets. (A) Compound-target network of QTF constructed using Cytoscape. (B) Venn diagram of common targets of QTF and intestinal fibrosis. (C) The PPI network analysis of core targets. (D) Hub-network extracted from the PPI network based on the degree value. (E) Hub-network extracted from the PPI network of the top 21 targets based on the degree value, Betweenness Centrality and Closeness Centrality.
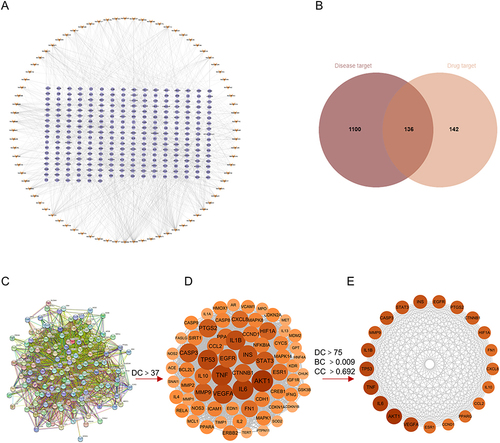
Figure 3 Potential Inflammation-Related Intestinal Fibrosis therapeutic mechanisms of QTF through network pharmacological analysis. (A–C) biological process analysis, cellular component analysis, and Molecular function analysis for 136 targets constructed. (D) Top 20 enriched KEGG pathways of QTF targets constructed. (E) Sankey diagram to analyze the KEGG signaling pathways. The diagram features two sets of rectangular nodes: those on the left represent the treatment targets, while the nodes on the right correspond to various KEGG pathways.
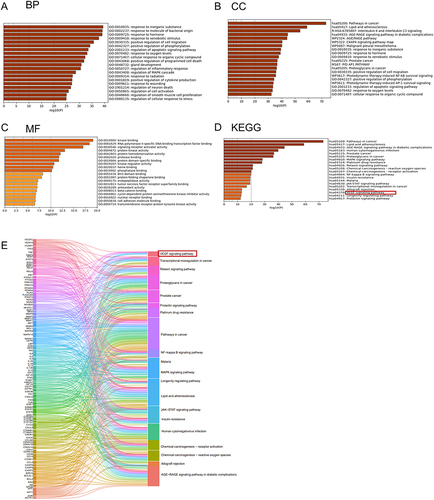
Figure 4 QTF attenuated intestinal colitis in TNBS-induced CD mice. (A) Animal experimental design. (B) Percent change in body weight of the mice during the experiment. (C and D) The ratio of colon weight/body weight change and colon weight/colon length change during the experiment. (E and F) mRNA expression levels of IL-6, IL- 1β, IL-17, and IL-23 in colon and small intestinal tissues. (G and H) H&E staining staining of colon and small intestinal tissues. Scale bar = 100 µm. Data is expressed as mean ± SEM (n ≥ 5). *P < 0.05 vs TNBS group, **P < 0.01 vs TNBS group, ***P < 0.001 vs TNBS group.
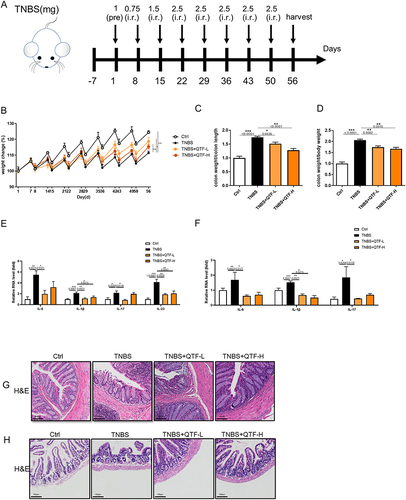
Figure 5 QTF attenuated TGF-β-induced expression of fibrosis factors in IEC-6 cells through TGF-β1/Smad. (A) The effect of different doses of QTF on the viability of IEC-6 cells (%). (B) mRNA expression levels of IL-6, IL- 1β, TNF-α, IL-17, and IL-23 in IEC-6 cells. (C–J) mRNA expression levels of fibrosis factors VEGFA, α-SMA, vimentin, Fibronectin, TIMP1, Collagen I, N-cadherin, and E-cadherin in IEC-6 cells. (K) Protein expression levels of fibrosis factors α-SMA and Vimentin in IEC-6 cells. (L–N) mRNA expression levels of fibrosis factors TGF-β1, Smad2, and Smad3 in IEC-6 cells. (O) Protein expression levels of fibrosis factors TGF-β1 and Smad2 in IEC-6 cells. Data is expressed as mean ± SEM (n ≥ 5). *P < 0.05 vs TNBS group, **P < 0.01 vs TNBS group, ***P < 0.001 vs TNBS group.
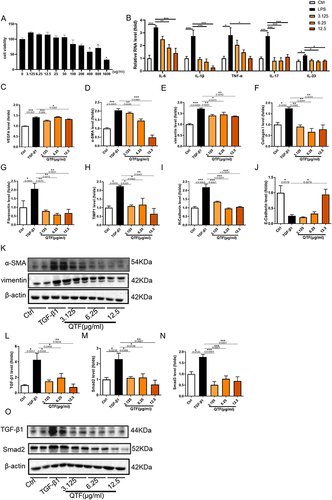
Figure 6 QTF attenuated colon fibrosis in TNBS-induced CD mice. (A–H) mRNA expression levels of VEGFA, α-SMA, Vimentin, Fibronectin, TIMP1, Collagen I, N-cadherin, and E-cadherin. (I) Masson staining trichrome staining of colon tissues. Scale bar = 100 μm. (J–K) The expression of fibrosis factors VEGFA and Collagen I in colon tissue was evaluated by immunofluorescence. Scale bar = 100 μm. (L–N) Relative protein expression levels and band intensities of fibrosis factors α-SMA and Vimentin in colon tissue, evaluated by Western blotting. (O–P) Protein expression levels of fibrosis factors α-SMA and Vimentin in colon tissue, evaluated by immunohistochemistry. Scale bar = 100 μm. Data is expressed as mean ± SEM (n ≥ 5). *P < 0.05 vs TNBS group, **P < 0.01 vs TNBS group, ***P < 0.001 vs TNBS group.
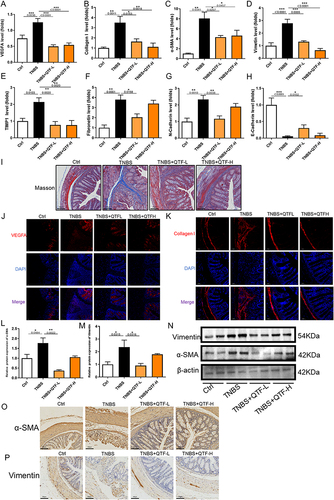
Figure 7 QTF alleviated colon fibrosis in TNBS-induced CD mice through TGF-β1/Smad. (A–D) mRNA expression levels of TGF-β1, Smad2, Smad3, and Smad4 in colon tissue. (E–G) Relative protein expression levels and band intensities of colonic fibrosis factors TGF-β1 and Smad2 in colon tissues, evaluated by Western blotting. (H–I) Protein expression levels of colonic fibrosis factor TGF-β1 and Smad2 in colon tissues, evaluated by immunohistochemistry. Scale bar = 100 μm. Data is expressed as mean ± SEM (n ≥ 5). *P < 0.05 vs TNBS group, **P < 0.01 vs TNBS group, ***P < 0.001 vs TNBS group.
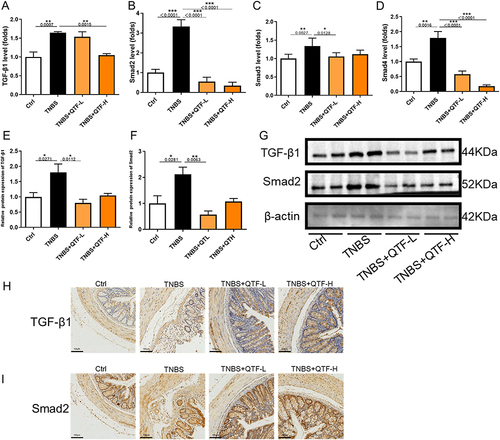
Figure 8 QTF attenuated fibrosis of the small intestine in TBNS-induced CD mice. (A-H) mRNA expression levels of VEGFA, α-SMA, Vimentin, Fibronectin, Collagen I, Collagen III, N-cadherin, and E-cadherin in small intestine tissues. (I) Masson’s trichrome staining of small intestine tissues. Scale bar = 100 μm. (J–K) The expression of fibrosis factor Collagen I and TGF-β1 in small intestine tissue, evaluated by immunofluorescence. Scale bar = 100 μm.(L-O) mRNA expression levels of TGF-β1, Smad2, Smad3, and Smad4 in small intestine tissues.
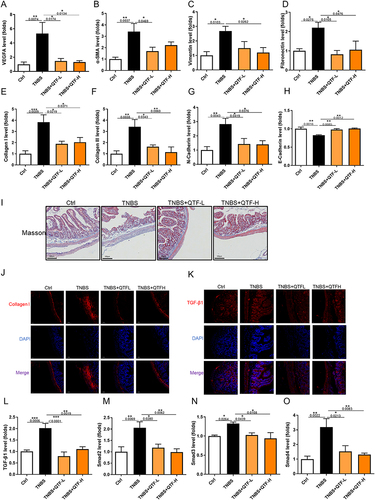
Table 6 The Binding Energy of Compound and Targets (Kcal/Mol)
Figure 9 Molecular Docking Analysis. (A) AKT1 with Flavone. (B) IL-6 with Flavone. (C) TNF with Flavone. (D) VEGFA with Flavone. (E) AKT1 with Isoflavone. (F) IL-6 with Isoflavone. (G) TNF with Isoflavone. (H) VEGFA with Isoflavone. The hydrogen bonds were indicated by dashed lines and the length was added around the lines.
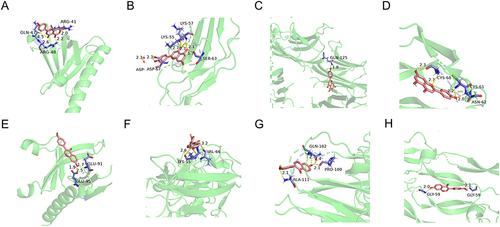
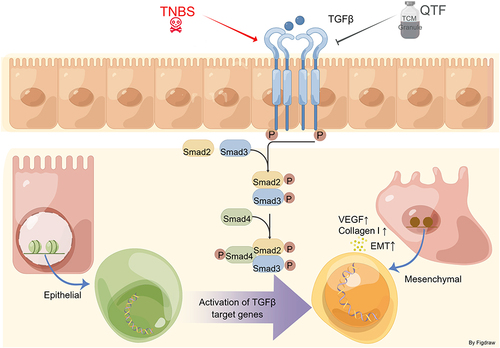
Figure 10 Signaling pathway displaying how QTF regulates CD-induced intestinal fibrosis through inhibiting the TGF-β1/Smad/VEGF pathway.