
Figures & data
Figure 1 The Consolidated Standards of Reporting Trials flow diagram.
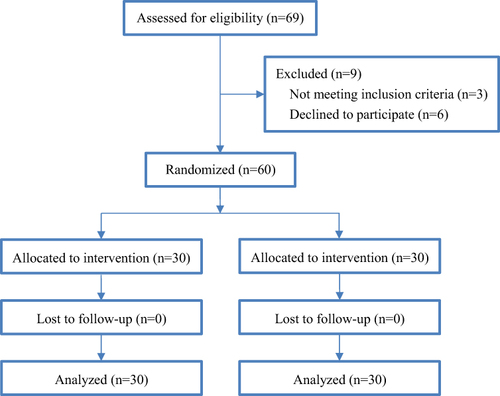
Table 1 Maternal Characteristics
Figure 2 The sequence number of responses to phenylephrine and norepinephrine infusion in the two groups of women with preeclampsia.
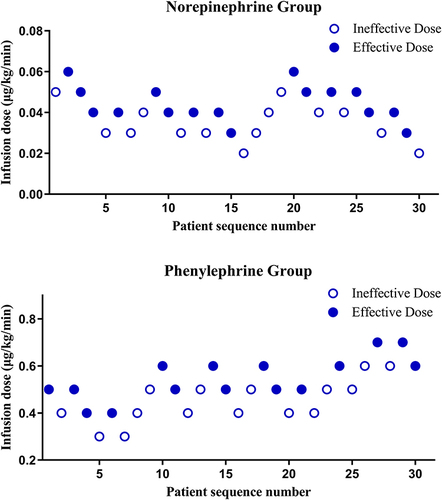
Figure 3 The dose-response curves and ED 90s (represented with the dotted lines) obtained from Probit regression analysis for both groups of women with preeclampsia in preventing spinal anesthesia-induced hypotension.
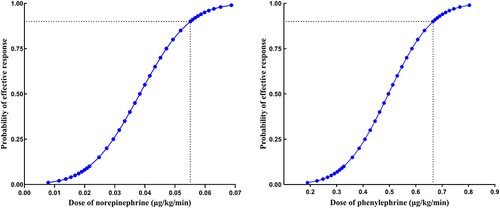
Table 2 Maternal and Neonatal Outcomes
Data Sharing Statement
The data that support the study findings are available from the corresponding author upon reasonable request.