Figures & data
Figure 1 Summary of the oDPM.
Abbreviations: DS, docking score; IP, interaction pattern; oDPM, One-dimensional Drug Profile Matching.
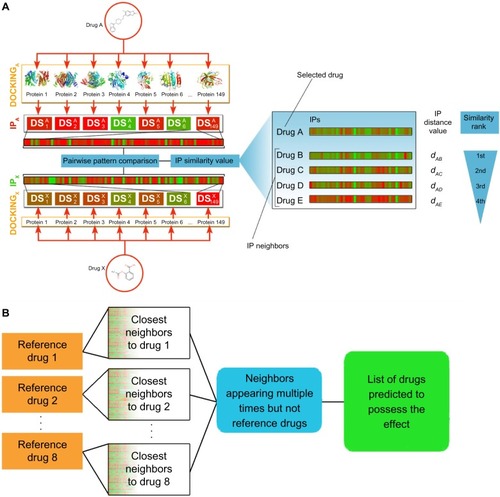
Table 1 Generic drugs showing PPARγ receptor ligand affinity after the One-dimensional Drug Profile Matching screening
Table 2 Interaction pattern distance values of the predicted ten generic drugs
Figure 2 The effect of (A) bromfenac, (B) nitazoxanide, (C) suprofen, and (D) lubiprostone (10−8 M to 10−5 M) on FABP4/aP2 gene expression in MM6 cell lines. Rosiglitazone (10−8 M to 10−6 M) was used as a positive control. *Indicates significant changes from the vehicle-treated (DDDT or ethanol) control.
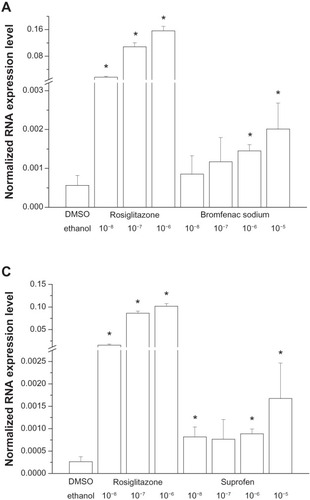
Figure 3 Relative fold change in the mRNA expression in response to the highest dose of various drugs.
Abbreviation: mRNA, messenger ribonucleic acid.
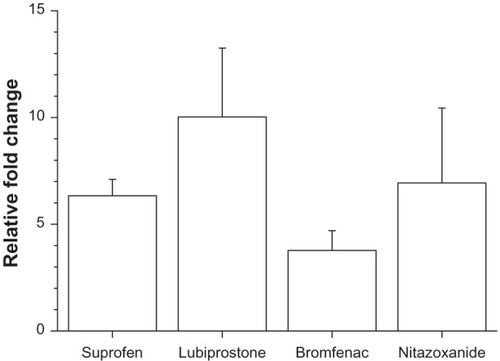
Table 3 The effect of 8-day nitazoxanide treatment (50 mg/kg/day, 100 mg/kg/day, and 200 mg/kg/day) on the fasting blood glucose and plasma insulin level, on the resting blood pressure, as well as on body weight
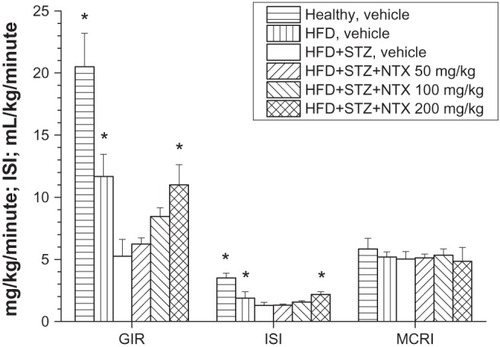
Figure 4 The effect of 8-day NTX treatment (50 mg/kg/day, 100 mg/kg/day, and 200 mg/kg/day per os twice a day) on the GIR, ISI, and on the MCRI. *Indicates statistically significant changes from the HFD + STZ and vehicle-treated groups.