Figures & data
Figure 1 The cytotoxic effects of ALS on malignant and normal breast epithelial cells.
Abbreviations: ALS, alisertib; MTT, thiazolyl blue tetrazolium bromide.
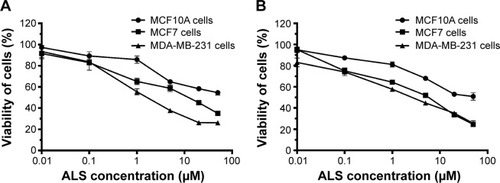
Figure 2 Effect of ALS concentrations on cell cycle distribution in MCF7 and MDA-MB-231 cells determined using flow cytometry.
Abbreviations: ALS, alisertib; SD, standard deviation; ANOVA, analysis of variance; PI, propidium iodide.
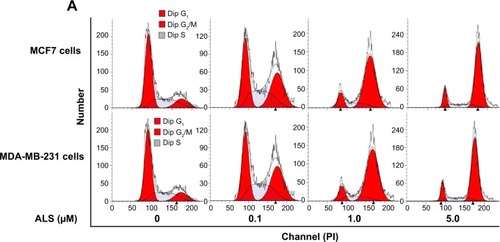
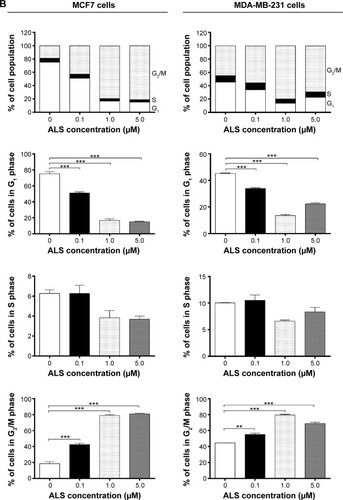
Figure 3 The time course of ALS-induced G2/M arrest in MCF7 and MDA-MB-231 cells determined by flow cytometry.
Abbreviations: ALS, alisertib; SD, standard deviation; ANOVA, analysis of variance; PI, propidium iodide.
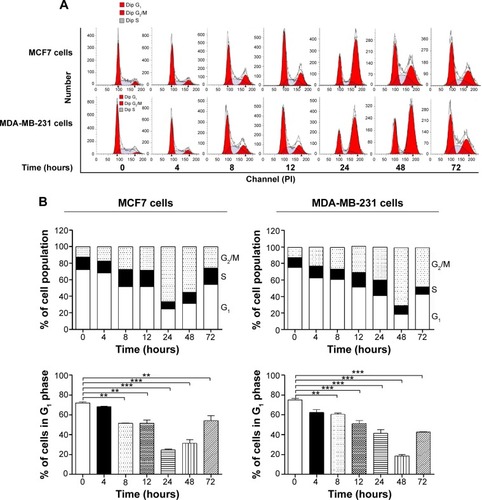
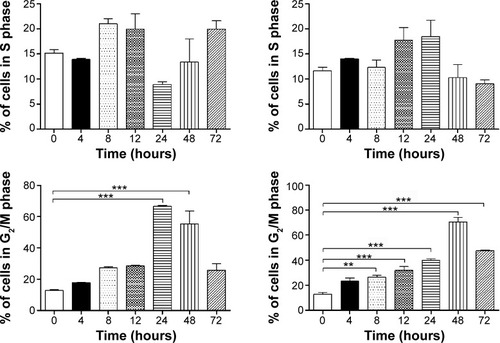
Figure 4 Effect of ALS concentrations on the expression levels of CDK1/CDC2, CDK2, cyclin B1, p21 Waf1/Cip1, p27 Kip1, and p53 in MCF7 and MDA-MB-231 cells.
Abbreviations: ALS, alisertib; SD, standard deviation; ANOVA, analysis of variance; CDK, cyclin-dependent kinase.
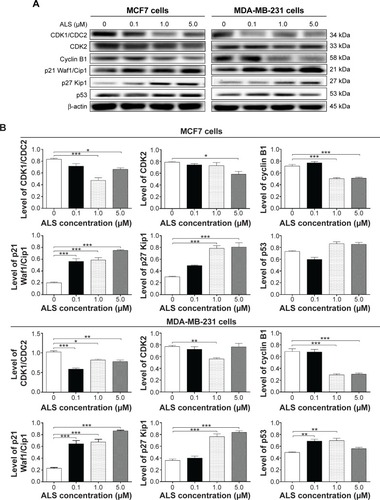
Figure 5 Effect of ALS treatment time on the expression levels of CDK1/CDC2, CDK2, cyclin B1, p21 Waf1/Cip1, p27 Kip1, and p53 in MCF7 and MDA-MB-231 cells.
Abbreviations: ALS, alisertib; SD, standard deviation; ANOVA, analysis of variance; CDK, cyclin-dependent kinase; conc, concentration.
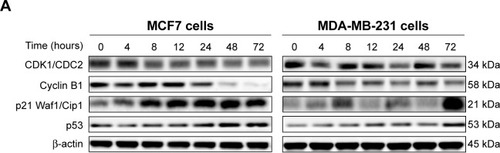
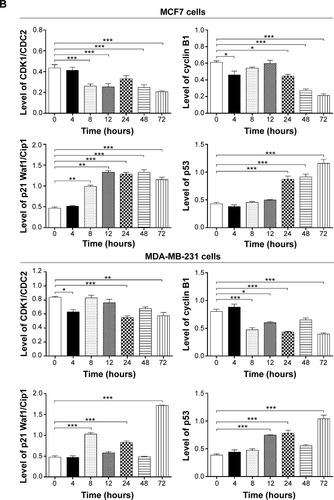
Figure 6 ALS induced apoptotic death in MCF7 and MDA-MB-231 cells in a concentration-dependent manner.
Abbreviations: 7-AAD, 7-aminoactinomycin D; ALS, alisertib; SD, standard deviation; ANOVA, analysis of variance; PE, phycoerythrin; Q1, debris.
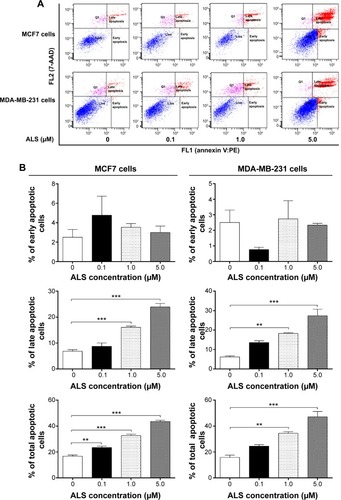
Figure 7 Effects of ALS concentrations on the expression levels of Bcl-2, Bax, PUMA, cleaved caspase 3, and cleaved caspase 9 in MCF7 and MDA-MB-231 cells determined by Western blotting assay.
Abbreviations: ALS, alisertib; SD, standard deviation; ANOVA, analysis of variance; Bcl-2, B-cell lymphoma 2; Bax, Bcl-2-associated X protein; PUMA, p53-upregulated modulator of apoptosis; casp, caspase.
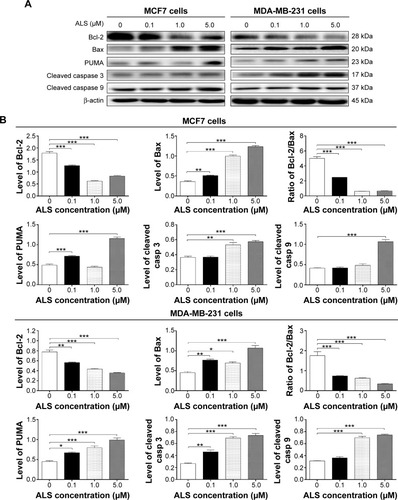
Figure 8 Effect of ALS concentrations on ALS-induced autophagic death in MCF7 and MDA-MB-231 cells.
Abbreviations: ALS, alisertib; SD, standard deviation; ANOVA, analysis of variance.
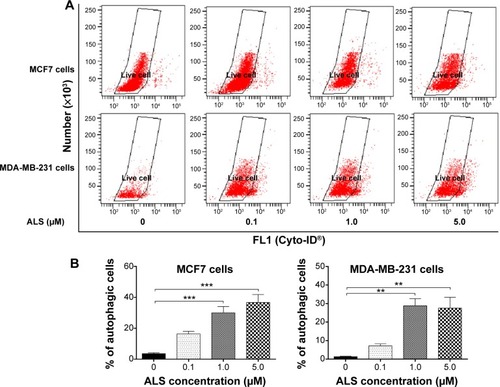
Figure 9 Effect of treatment time on ALS-induced autophagic cell death in MCF7 and MDA-MB-231 cells.
Abbreviations: ALS, alisertib; SD, standard deviation; ANOVA, analysis of variance.
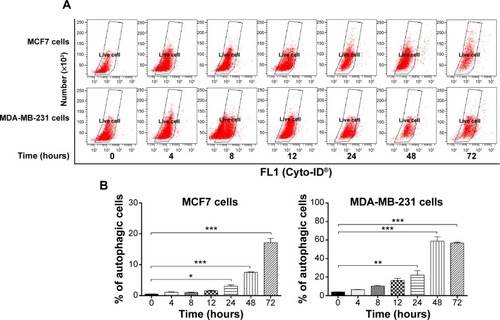
Figure 10 Effect of ALS concentrations on the phosphorylation of p38 MAPK, PI3K, Akt, and mTOR and the levels of beclin 1, LC3-I, and LC3-II in MCF7 and MDA-MB-231 cells.
Abbreviations: ALS, alisertib; SD, standard deviation; ANOVA, analysis of variance; MAPK, mitogen-activated protein kinase; PI3K, phosphatidylinositol 3-kinase; Akt, protein kinase B; mTOR, mammalian target of rapamycin; LC3, microtubule-associated protein 1 light chain 3; p-p38 MAPK, phosphorylated p38 MAPK.
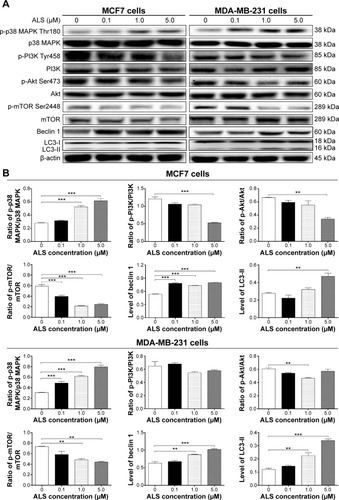
Figure 11 Effect of ALS treatment time on the phosphorylation of p38 MAPK, PI3K, Akt, and mTOR and the expression levels of beclin 1, LC3-I, and LC3-II in MCF7 and MDA-MB-231 cells.
Abbreviations: p, phosphorylated; ALS, alisertib; SD, standard deviation; ANOVA, analysis of variance; MAPK, mitogen-activated protein kinase; PI3K, phosphatidylinositol 3-kinase; Akt, protein kinase B; mTOR, mammalian target of rapamycin; LC3, microtubule-associated protein 1 light chain 3.
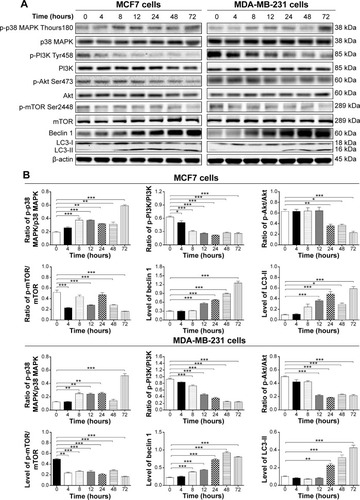
Figure 12 Effect of various autophagy inhibitors on basal and ALS-induced autophagy in MCF7 and MDA-MB-231 cells.
Abbreviations: ALS, alisertib; SD, standard deviation; ANOVA, analysis of variance; WM, wortmannin; DMSO, dimethyl sulfoxide; Baf A1, bafilomycin A1.
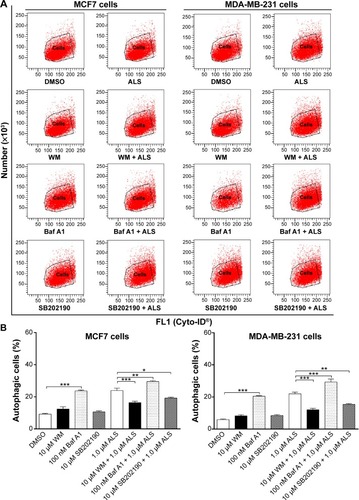
Figure 13 Effect of various autophagy inhibitors on the expression levels of p-p38 MAPK, p38 MAPK, beclin 1, and LC3-I/II in MCF7 and MDA-MB-231 cells in the presence or absence of ALS.
Abbreviations: ALS, alisertib; SD, standard deviation; ANOVA, analysis of variance; WM, wortmannin; LC3, microtubule-associated protein 1 light chain 3; p-p38 MAPK, phosphorylated p38 MAPK; DMSO, dimethyl sulfoxide; Baf A1, bafilomycin A1.
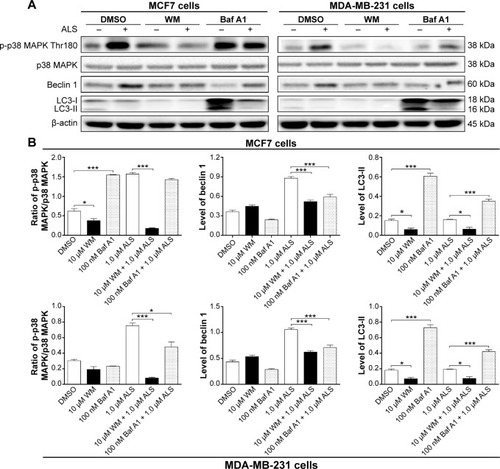
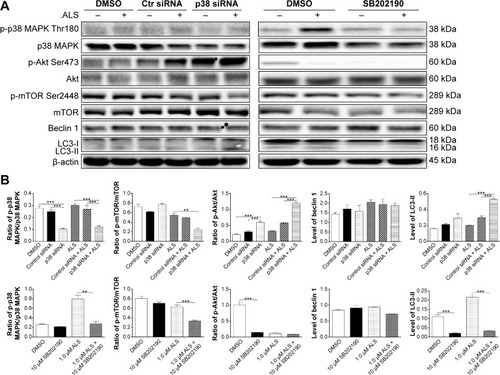
Figure 14 Effect of p38 MAPK knockdown by siRNA interference and chemical inhibition by SB202190 p38 MAPK, p38 MAPK, p-Akt, Akt, p-mTOR, mTOR, beclin 1, LC3-I, and LC3-II in MCF7 cells in the presence or absence of ALS.
Abbreviations: ALS, alisertib; SD, standard deviation; ANOVA, analysis of variance; p-p38 MAPK, phosphorylated p38 MAPK; Akt, protein kinase B; mTOR, mammalian target of rapamycin; LC3, microtubule-associated protein 1 light chain 3; DMSO, dimethyl sulfoxide; siRNA, small interfering ribonucleic acid.