
Figures & data
Table 1 Clinical trials performed in PD population
Figure 1 Percentage of patients showing decreasing, no change, and increasing DRS scores (analysis for population with DRS ≥0 and no change in the l-dopa dosage during the 24-month study).
Note: Adapted from Cattaneo et al.Citation21
Abbreviations: DRS, Dyskinesia Rating Scale; l-dopa, levodopa; SAF, safinamide.
Abbreviations: DRS, Dyskinesia Rating Scale; l-dopa, levodopa; SAF, safinamide.
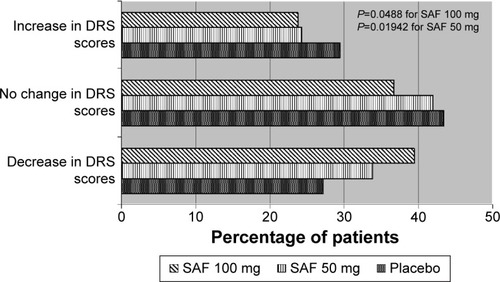
Table 2 Study 015: TEAEs reported by at least 5% of patients in any treatment groups
Table 3 Study 016: most common AE reported by at least 5% of patients in any treatment groups