Figures & data
Figure 1 Flow diagram of the publication selection process.
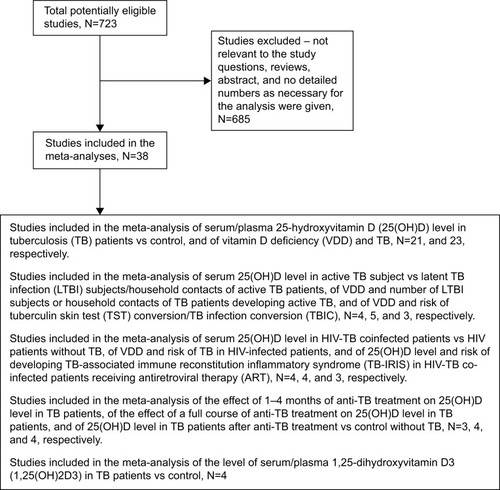
Figure 2 (A) Forest plot of comparison of vitamin D level (serum 25-hydroxyvitamin D [25(OH)D]) in TB patients vs control: overall effect for continuous outcome using a random-effect model. (B) Forest plot of association between VDD and risk of TB: overall effect for dichotomous outcome using a random-effect model. The diamonds stand for pooled effect.
![Figure 2 (A) Forest plot of comparison of vitamin D level (serum 25-hydroxyvitamin D [25(OH)D]) in TB patients vs control: overall effect for continuous outcome using a random-effect model. (B) Forest plot of association between VDD and risk of TB: overall effect for dichotomous outcome using a random-effect model. The diamonds stand for pooled effect.](/cms/asset/30ec4559-e8e7-4de6-a3f3-60aa8d04029b/dddt_a_79870_f0002_b.jpg)
Figure 3 (A) Forest plot of comparison of serum 25(OH)D level in active TB patients vs LTBI subjects/household contacts of active TB patients: overall effect for continuous outcome using a random-effect model. (B) Forest plot of association between VDD and risk of developing active TB in LTBI subjects or household contacts of TB patients: overall effect for dichotomous outcome using a random-effect model. (C) Forest plot of association between VDD and risk of TST conversion/TBIC: overall effect for dichotomous outcome using a fixed-effect model. The diamonds stand for pooled effect.
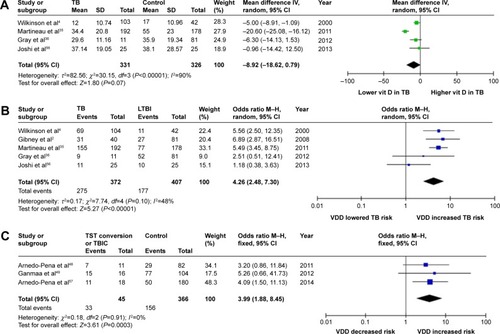
Figure 4 (A) Forest plot of comparison of serum 25(OH)D level in HIV-TB-coinfected patients vs HIV patients without active TB: overall effect for continuous outcome using a random-effect model. (B) Forest plot of association between VDD and risk of TB in HIV-infected patients: overall effect for dichotomous outcome using a random-effect model. (C) Forest plot comparing 25(OH)D level in HIV-TB-coinfected patients receiving ART who developed TB-IRIS vs HIV-TB-coinfected patients receiving ART who did not develop TB-IRIS: overall effect for continuous outcome using a fixed-effect model. The diamonds stand for pooled effect.
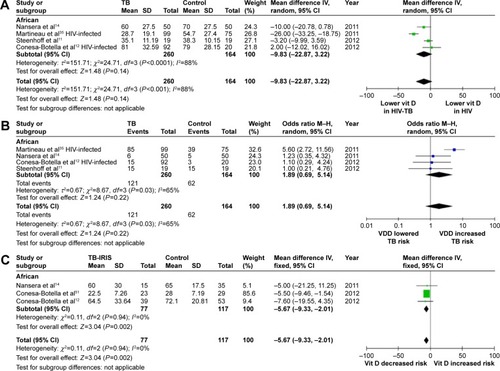
Figure 5 (A) Forest plot of the effect of 1–4 months of anti-TB treatment on vitamin D level (25(OH)D) in TB patients: overall effect for continuous outcome using a random-effect model. (B) Forest plot of the effect of a full course of anti-TB treatment on vitamin D level (25(OH)D) in TB patients: overall effect for continuous outcome using a random-effect model. (C) Forest plot of comparison of vitamin D level (25(OH)D) in TB patients after anti-TB treatment vs control without TB: overall effect for continuous outcome using a random-effect model. The diamonds stand for pooled effect.
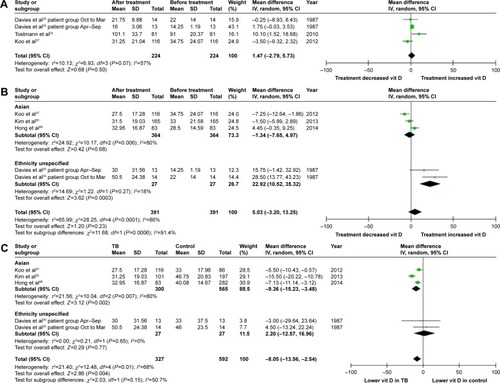
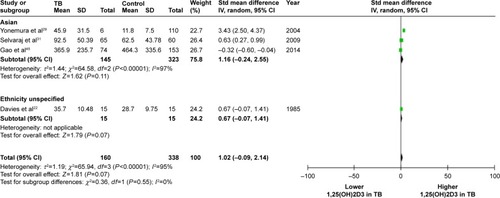
Figure 6 Forest plot of comparison of the level of the vitamin D metabolite – serum/plasma 1,25-dihydroxyvitamin D3 (1,25(OH)2D3) in TB patients vs control without TB: overall effect for continuous outcome using a random-effect model.
Abbreviations: TB, tuberculosis; SD, standard deviation; CI, confidence interval; df, degrees of freedom; IV, independent variable.