Figures & data
Figure 1 Proliferation of prostate cancer cells were inhibited by PACE4 siRNA.
Notes: Human prostate cancer cell lines DU145 (A), LNCaP (B), and PC3 (C) were transfected with PACE4 siRNA or control siRNA for the indicated time. Cell proliferation was examined by CCK-8 assay. The OD value in each well was read at the wave length of 450 nm on a microtiter plate reader. Data represented mean ± SD of OD 450 at 12, 24, 36, and 48 hours of siRNA transfection (each concentration was tested in triplicate) (*P<0.05 and **P<0.01).
Abbreviations: CCK, cell-counting kit; OD, optical density; SD, standard deviation; siRNA, small interfering RNA.
Abbreviations: CCK, cell-counting kit; OD, optical density; SD, standard deviation; siRNA, small interfering RNA.
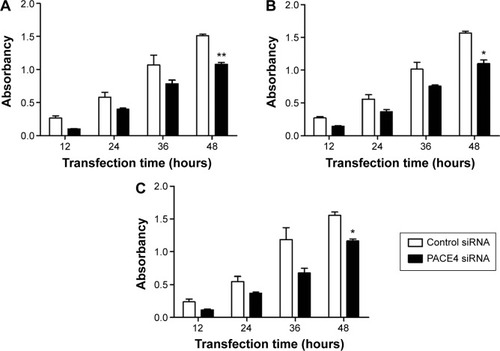
Figure 2 PACE4 siRNA induces cell cycle arrest in prostate cancer cells.
Notes: (A) Cell cycle detection in DU145 cells in (a) the control siRNA and (b) PACE4 siRNA group, and (c) statistical analysis of the G0/G1, G2M, and S phase cells in the two groups. (B) Cell cycle detection in LNCaP cells in (a) the control siRNA and (b) PACE4 siRNA group, and (c) statistical analysis of the G0/G1, G2M, and S phase cells in the two groups. (C) Cell cycle detection in PC3 cells in (a) the control siRNA and (b) PACE4 siRNA group, and (c) statistical analysis of the G0/G1, G2M, and S phase cells in the two groups. Statistical differences of the value of PACE4 siRNA group compared with control siRNA were illustrated as *P<0.05, **P<0.01.
Abbreviation: siRNA, small interfering RNA.
Abbreviation: siRNA, small interfering RNA.
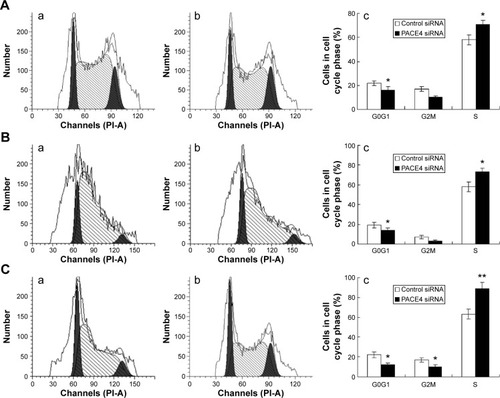
Figure 3 PACE4 siRNA significantly increased apoptosis of prostate cancer cells.
Notes: DU145 (A), LNCaP (C), and PC3 (E) cells were transfected with PACE4 siRNA or control siRNA for 48 hours, then cells were counted ‘‘blindly’’ three times. The cells transfected with PACE4 siRNA exhibited higher ratio of apoptotic cells when compared with the control siRNA group (*P<0.05 and **P<0.01). (B, D, and F) After 48 hours of transfection, cells were incubated with Hoechst 33258 staining buffer. Healthy cells showed round and intact nuclei, whereas apoptotic cells exhibited nuclear karyopyknosis or fragmentation, as the arrows show.
Abbreviation: siRNA, small interfering RNA.
Abbreviation: siRNA, small interfering RNA.
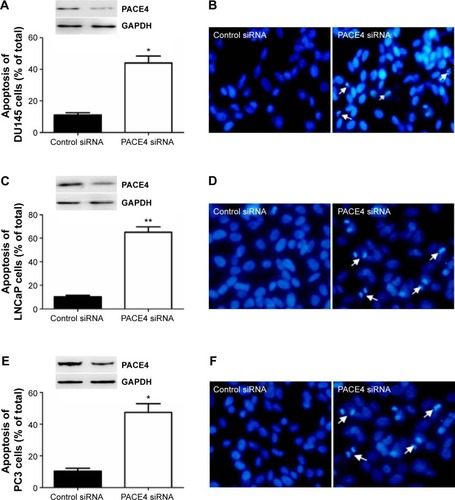
Figure 4 Western blot analysis of apoptotic-related proteins after PACE4 siRNA transfection.
Notes: (A, D, and G) Relative luminescence expression of caspase-3/7 in DU145 (A), LNCaP (D), and PC3 (G) cells transfected with PACE4 siRNA or control siRNA for 48 hours. The data represent the mean ± SD of three independent experiments. *P<0.05 compared with the control group. (B, E, and H) Representative western blot images from DU145, LNCaP, and PC3 cells, respectively. (C, F, and I) Three such experiments were quantified from B, E, and H by measuring the intensity of apoptotic-related proteins relative to the GAPDH (loading) control (*P<0.05 and **P<0.01). The bars indicate mean ± SD (n=3).
Abbreviations: SD, standard deviation; siRNA, small interfering RNA.
Abbreviations: SD, standard deviation; siRNA, small interfering RNA.
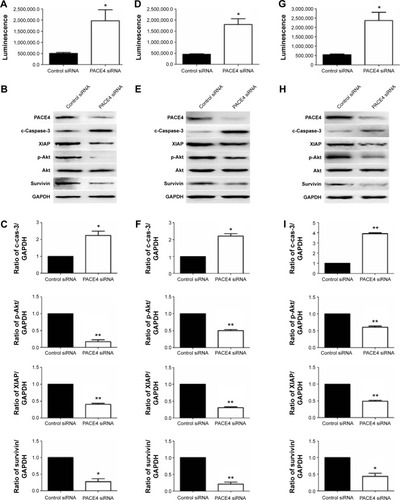
Figure 5 Regulation of mediators in the mitochondrial pathway in apoptotic cells by PACE4 siRNA.
Notes: (A, C, and E) DU145, LNCaP, and PC3 cells were transfected with PACE4 siRNA or control siRNA for 48 hours, and the levels of cyto c in mitochondria (COXIV as loading control) and cytosol (GAPDH as loading control) were measured by western blot. PACE4 siRNA inhibited Bcl-2 expression and increased Bax expression, as detected by western blot. (B, D, and F) Quantitative analysis of the expression of proteins. The bars indicate mean ± SD (n=3). *P<0.05 and **P<0.01 vs control siRNA group.
Abbreviations: Cyto c, cytochrome c; SD, standard deviation; siRNA, small interfering RNA; vs, versus.
Abbreviations: Cyto c, cytochrome c; SD, standard deviation; siRNA, small interfering RNA; vs, versus.
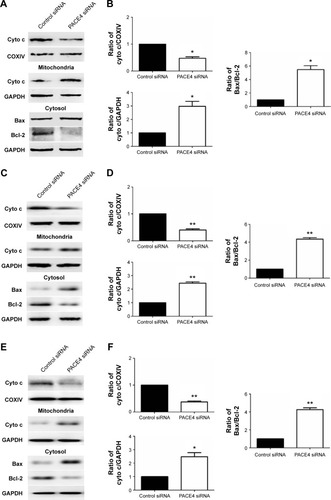
Figure 6 Effects of PACE4 siRNA on ER stress-associated proteins in prostate cancer cells.
Notes: (A, C, and E) DU145, LNCaP, and PC3 cells were transfected with PACE4 siRNA or control siRNA for 48 hours before being subjected to protein extraction and western blot with the indicated antibodies. (B, D, and F) Three such experiments were quantified from A, C, and E by measuring the intensity of ER stress-related proteins relative to the GAPDH (loading control) (*P<0.05 and **P<0.01). The bars indicate mean ± SD (n=3).
Abbreviations: ER, endoplasmic reticulum; SD, standard deviation; siRNA, small interfering RNA.
Abbreviations: ER, endoplasmic reticulum; SD, standard deviation; siRNA, small interfering RNA.
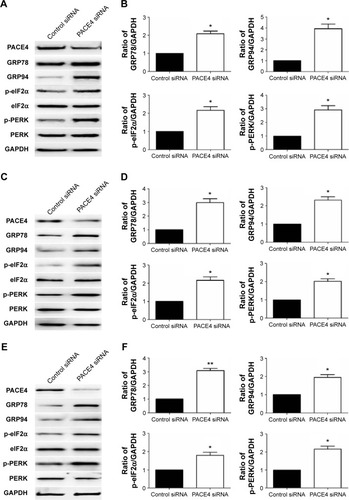
Figure 7 Observation of apoptosis in PACE4 gene knockdown prostate cancer cell lines.
Notes: (A and C) mitochondrial apoptotic pathway biomarkers (Bcl-2 and Bax) and an ER stress biomarker (GRP78) were detected in PACE4 gene knockdown cell lines and control group (blank prostate cancer cell lines). (B and D) Three such experiments were quantified from A and C by measuring the ratio of Bax/Bcl-2 or the intensity of ER stress-related proteins relative to the GAPDH (loading control) (*P<0.05 and **P<0.01). The bars indicate mean ± SD (n=3).
Abbreviations: ER, endoplasmic reticulum; SD, standard deviation.
Abbreviations: ER, endoplasmic reticulum; SD, standard deviation.
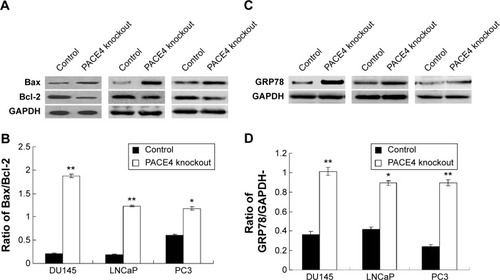
Figure S1 Observation of the cell death, using MMT assay.
Notes: Human prostate cancer cell lines DU145 (A), LNCaP (B), and PC3 (C) were transfected with PACE4 siRNA or control siRNA for the indicated times. Cell proliferation was examined by MTT assay. The OD value in each well was read at the wave length of 450 nm on a microtiter plate reader. Data represent mean ± SD of OD 450 at 12, 24, 36, and 48 hours of siRNA transfection (each concentration was tested in triplicate) (*P<0.05 and **P<0.01).
Abbreviations: MTT, 3-(4,5-dimethylthiazol-2-yl)-2,5-diphenyltetrazolium bromide; OD, optical density; SD, standard deviation; siRNA, small interfering RNA.
Abbreviations: MTT, 3-(4,5-dimethylthiazol-2-yl)-2,5-diphenyltetrazolium bromide; OD, optical density; SD, standard deviation; siRNA, small interfering RNA.