Figures & data
Figure 1 The rationale for the design of the target compounds.
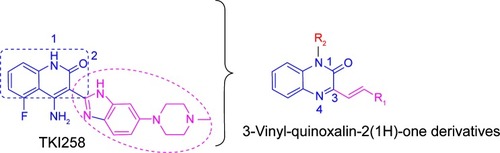
Figure 2 The design of four series of quinoxaline derivatives.
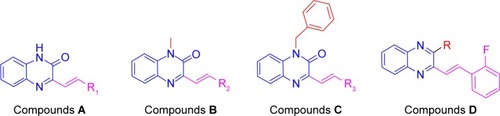
Figure 3 The synthetic pathway for quinoxaline derivatives A1–A14, B1–B5, C1–C5, and D1–D3.
Notes: Reagents and conditions: (i) pyruvate acid, N-butanol, reflux, 3 hours, 80.5%; (ii) substituted aldehyde, acetic anhydride, piperidine, reflux, 8 hours; (iii) dry acetone, benzyl bromide, anhydrous potassium carbonate, 60°C, reflux, 5 hours; (iv) pyruvate acid, C2H5OH, reflux, 2 hours, 72.1%; (v) substituted aldehyde, Ac2O, piperidine, reflux, 6–8 hours; (vi) POCl3, heated and stirred, 3 hours; (vii) morphine, dioxane, toluene sulfonic acid, 90°C, heated and stirred, 6 hours; (viii) N-methyl piperazine, dioxane, toluene sulfonic acid, 90°C, heated and stirred, 6 hours.
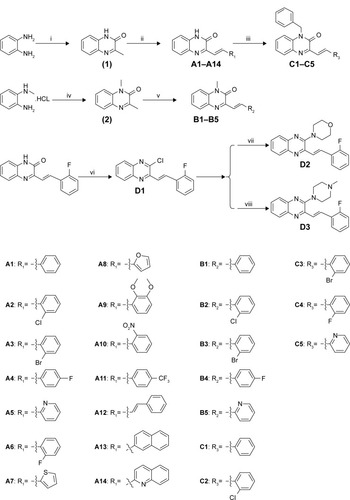
Table 1 Specificity and potency of compounds kinase inhibitor
Figure 4 Kinase inhibition profile for these 27 compounds against FGFR1 at 10, 1, and 0.1 µM.
Notes: Percent inhibition = (max − conversion)/(max − min) ×100, where “max” stands for DMSO control, and “min” stands for low control. Values are mean ± SEM. n=3.
Abbreviations: DMSO, dimethyl sulfoxide; SEM, standard error of the mean.
Abbreviations: DMSO, dimethyl sulfoxide; SEM, standard error of the mean.
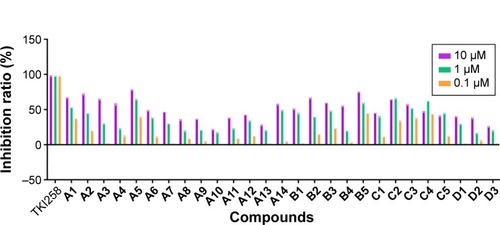
Table 2 Cellular antiproliferative activity
Figure 5 Relative cell viability of HL7702 cells by compounds (TKI258 and A5) treatment at 2 (A) and 10 µM (B) as illustrated above.
Notes: The values = conversion/(max − min), where “max” stands for DMSO control, and “min” stands for low control. Data are mean ± SEM from three independent experiments.
Abbreviations: DMSO, dimethyl sulfoxide; SEM, standard error of the mean.
Abbreviations: DMSO, dimethyl sulfoxide; SEM, standard error of the mean.
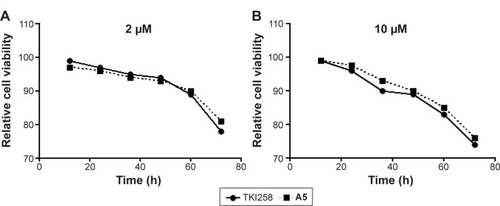
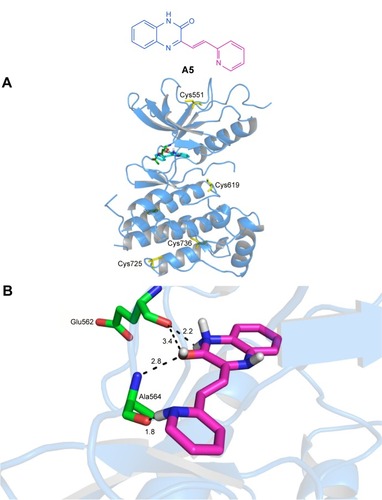
Figure 6 Molecular docking of compound A5 and FGFr1.
Notes: (A) Molecular docking between the new compound A5 and ATP-binding pocket of the FGFR1. (B) Hydrogen bonds formed by FGFR1 and A5.