
Figures & data
Table 1 Baseline clinicopathological features of 579 patients
Table 2 Univariate and multivariate survival analyses
Figure 1 Unadjusted overall survival curves for independent factors by univariate analyses: TNM stage (A), LNR (B), LVI (C), pre-CEA (D), and pre-Hb (E). Abbreviations: pre-, preoperative; CEA, carcinoembryonic antigen; Hb, hemoglobin; CA19-9, carbohydrate antigen 19-9; LNR, lymph node ratio; LVI, lymphovascular invasion.
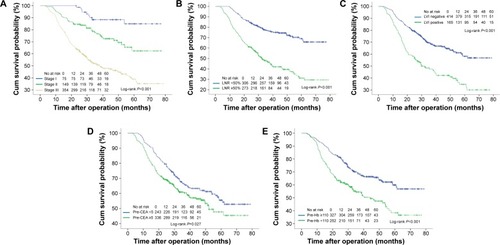
Table 3 Definition of score index based on the coefficient in the final Cox model
Table 4 Survival outcomes according to risk stratification by Model A and Model B
Figure 2 Kaplan–Meier analysis of overall survival, according to risk prognostic score from Model A (two classes, A) and Model B (three classes, B).
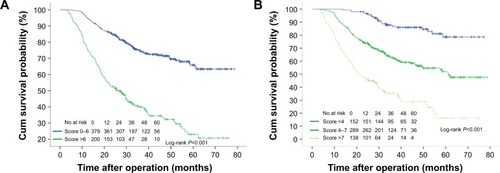
Figure 3 The relationship between 5-year survival and UICC stage classification of patients in Models A and B.
Abbreviation: UICC, International Union Against Cancer.
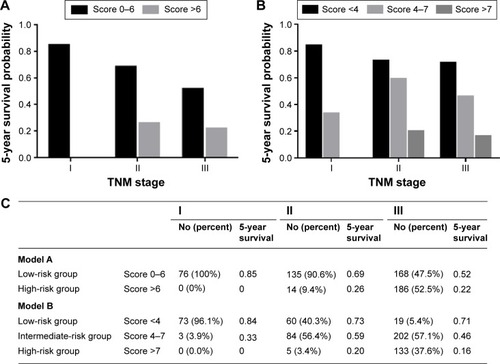
Figure 4 Kaplan–Meier curves of overall survival (OS) in gastric cancer patients according to adjuvant chemotherapy with or without paclitaxel (A and B), oxaliplatin (C and D), and cisplatin (E and F) stratified by Model A.
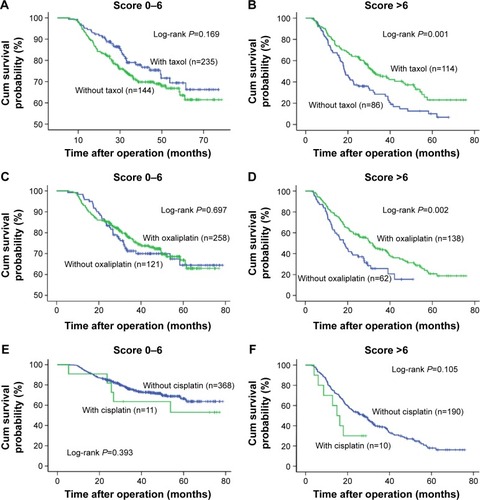
Figure 5 Kaplan–Meier curves depicting OS of gastric cancer patients according to the number of cytotoxic agents stratified by Model A (A and B) and Model B (C–E).
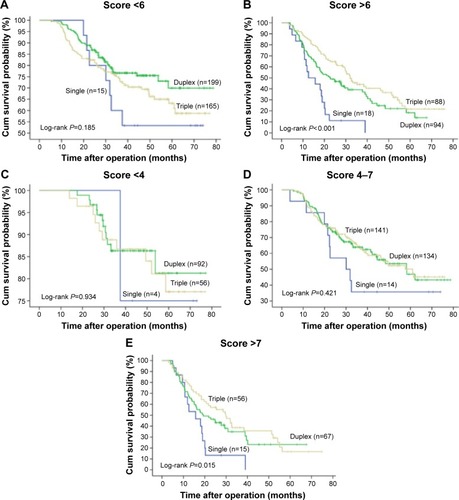
Figure S1 Flow chart outlining patient selection.
Figure S2 Maximally selected log-rank statistics plot for optimal cutoff point identification in Model A.
Figure S3 ROC analysis of two prognostic models compared with TNM alone to predict patient probability for 5-year survival.
Figure S4 Kaplan–Meier curves of OS in gastric cancer patients according to adjuvant chemotherapy with or without taxol (A–C), oxaliplatin (D–F), and cisplatin (G–I) stratified by Model B.
Table S1 Adjuvant chemotherapy regimens
Table S2 Adjuvant chemotherapy regimens and dosing schedules