Figures & data
Figure 1 Inhibition of MDM2 induces cell apoptosis and p53 upregulation in human RCC cells.
Notes: *P<0.05; **P<0.01. (A) Apoptosis assays were performed to examine the A498 cell apoptosis responding to 5, 10, and 20 nM MI-319 for 48 hours; (B) percentage of apoptosis. (C) Western blot analysis of p53, HIF1α, p21, MDM2, Bax, p-mTOR (Ser2448), mTOR, p-S6K (Ser389), and β-actin levels responding to 5, 10, and 20 nM MI-319. (D) Protein bands in (C) were quantified by densitometric analysis and normalized to β-actin.
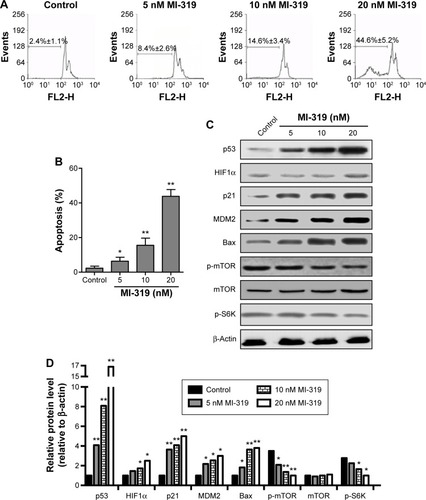
Figure 2 Inhibition of mTOR signaling leads to apoptosis and remarkable HIF1α upregulation in human RCC cells.
Notes: *P<0.05; **P<0.01. (A) A498 cell apoptosis responding to 5, 10, and 20 nM rapamycin for 48 hours was determined by cell-apoptosis assays; (B) percentage of apoptotic cells. The protein levels of p53, HIF1α, p21, MDM2, Bax, p-mTOR (Ser2448), mTOR, p-S6K (Ser389), and β-actin were examined by Western blot analysis (C) and quantified by densitometric analysis (D).
Abbreviation: Rap, rapamycin.
Abbreviation: Rap, rapamycin.
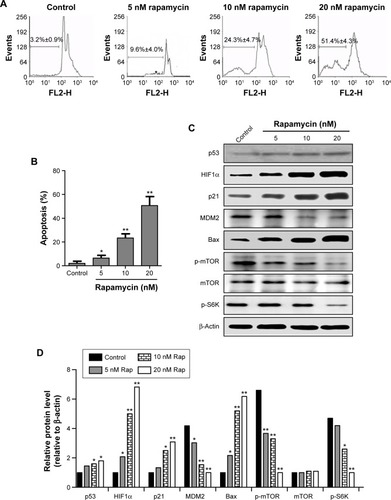
Figure 3 p53 and HIF1α mediate MDMD2 and mTOR inhibition-induced apoptosis respectively.
Notes: *P<0.05; **P<0.01. (A) The protein levels of p53 and HIF1α (normalized to β-actin) cells responding to MI-319 and rapamycin (5, 10, and 20 nM) were compared. The protein level in the control group was set at 1. (B) p53 siRNA or control siRNA was transfected into A498 cells and cells collected for Western blot analysis of knockdown efficiency after transfection for 48 hours. Control siRNA- or p53 siRNA-transfected A498 cells were treated with 20 nM MI-319 (C) or 20 nM rapamycin (D), and cell apoptosis was determined. (E) The knockdown efficiency of HIF1α siRNA was determined by Western blot analysis. A498 cells were transfected with control siRNA or HIF1α siRNA, treated with 20 nM MI-319 (F) or 20 nM rapamycin (G), and subjected to apoptosis assays.
Abbreviations: siRNA, small interfering RNA; Rap, rapamycin.
Abbreviations: siRNA, small interfering RNA; Rap, rapamycin.
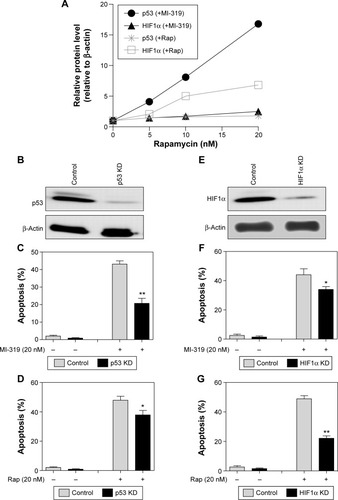
Figure 4 The synergistic roles of MDM2 and mTOR inhibition in A498 cell apoptosis.
Notes: *P<0.05; **P<0.01. (A) A498 cells were treated with 5 nM MI-319, 5 nM rapamycin, or combinations of both inhibitors (5 nM for both antagonists) for 48 hours, and apoptosis was determined. The proteins levels of p53, HIF1α, p21, Bax, and β-actin were determined by Western blot analysis (B) and quantified (C).
Abbreviations: MI, MI-319; Rap, rapamycin.
Abbreviations: MI, MI-319; Rap, rapamycin.
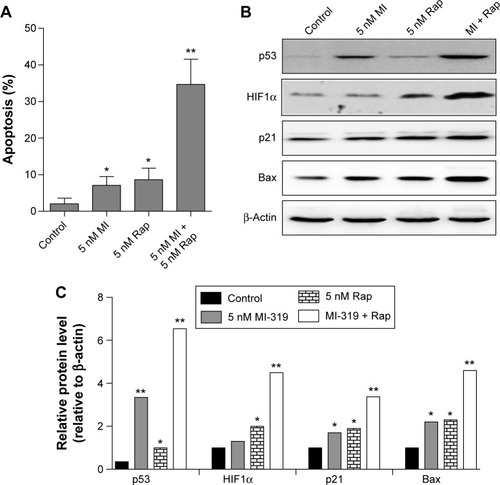
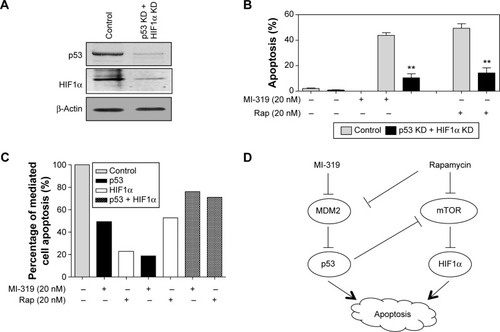
Figure 5 p53 and HIF1α cooperatively mediate antagonist-induced apoptosis.
Notes: **P<0.01. (A) p53 and HIF1α were concurrently knocked down by transfection of p53 siRNA and HIF1α siRNA. Knockdown efficiency was tested by Western blot. (B) Control siRNA- or p53 siRNA- and HIF1α siRNA-transfected cells were treated with 20 nM MI-319 or 20 nM rapamycin. Then, cell apoptosis was determined by apoptosis assays. (C) Statistical analysis of the percentages of p53- and HIF1α-mediated apoptosis responding to mTOR or MDM2 inhibition. For example, for p53-mediated apoptosis responding to MI-319 (20 nM), the percentage was calculated from (output = [1− percentage of apoptosis in p53-knockdown group responding to MI-319/percentage of apoptosis in control group responding to MI-319] ×100). The control group without antagonist treatment was normalized to 100%. (D) Model of p53 and HIF1α actions downstream of mTOR and MDM2 antagonists in RCC cell apoptosis.
Abbreviations: siRNA, small interfering RNA; KD, knockdown; Rap, rapamycin.
Abbreviations: siRNA, small interfering RNA; KD, knockdown; Rap, rapamycin.