Figures & data
Figure 1 The flow diagram of the study.
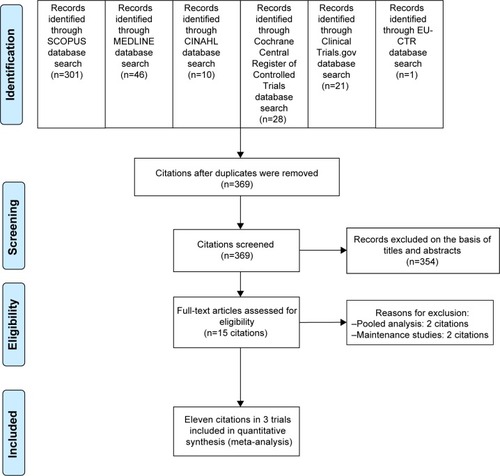
Table 1 Basic characteristics of controlled trials of quetiapine vs placebo in generalized anxiety disorder
Table 2 Summary of risk of bias in clinically controlled trials of quetiapine vs placebo in generalized anxiety disorder
Figure 2 The forest plot of comparison of the mean changes from the baseline of the HAM-A scores (95% confidence interval) of quetiapine vs placebo in GAD.
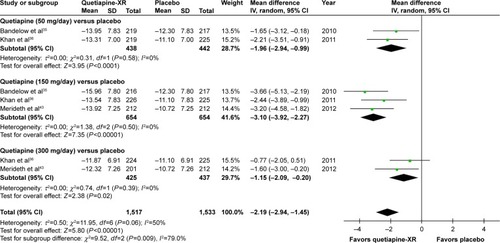
Figure 3 The forest plot of comparison of relative risks (95% confidence interval) for the clinical response rates of quetiapine vs placebo in GAD.

Figure 4 The forest plot of comparison of relative risks (95% confidence interval) for the clinical remission rates of quetiapine vs placebo in GAD.
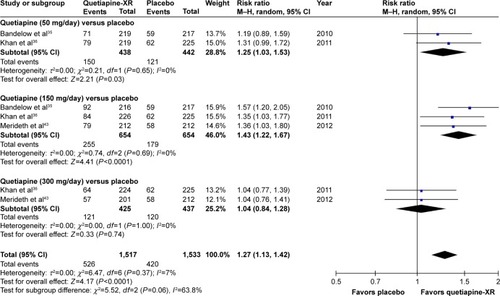
Figure 5 The forest plot of comparison of the mean changes from the baseline of the CGI-S scores (95% confidence interval) of quetiapine vs placebo in GAD.
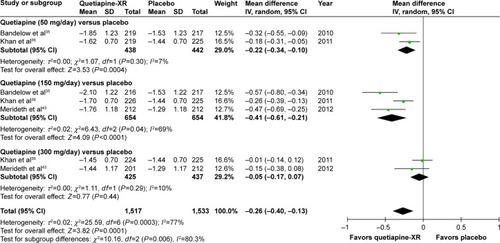
Figure 6 The forest plot of comparison of relative risks (95% confidence interval) for the clinical improvement rate (CGI-I =1, 2) of quetiapine vs placebo in GAD.
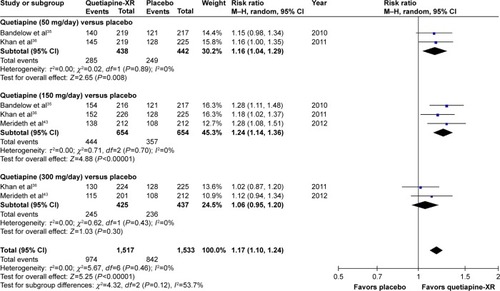
Figure 7 The forest plot of comparison of the mean changes from the baseline of the HAM-A scores (95% confidence interval) of quetiapine vs SSRIs in GAD.
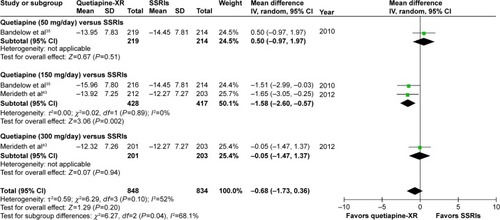
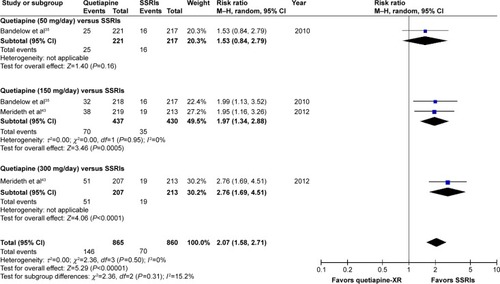
Figure 8 The forest plot of comparison of relative risks (95% confidence interval) for the clinical response rates of quetiapine vs SSRIs in GAD.
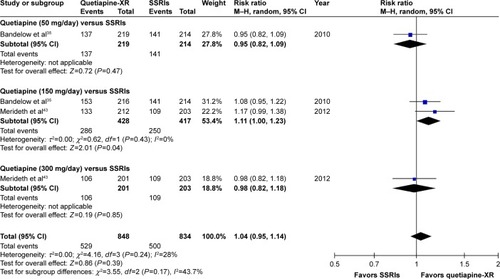
Figure 9 The forest plot of comparison of relative risks (95% confidence interval) for the clinical remission rates of quetiapine vs SSRIs in GAD.
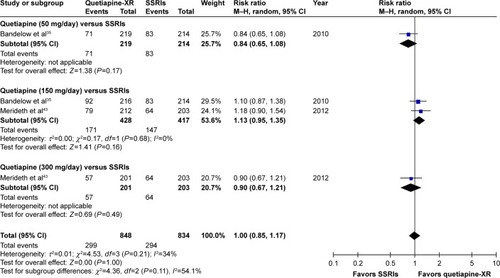
Figure 10 The forest plot of comparison of the mean changes from the baseline of the CGI-S scores (95% confidence interval) of quetiapine vs SSRIs in GAD.
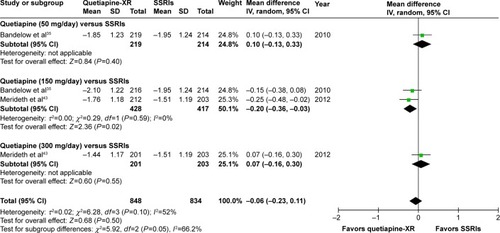
Figure 11 The forest plot of comparison of relative risks (95% confidence interval) for the clinical improvement rate (CGI-I =1, 2) of quetiapine vs SSRIs in GAD.
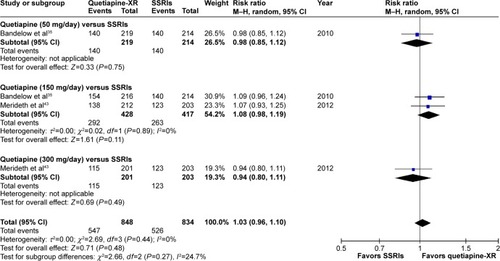
Figure 12 The forest plot of comparison of the mean changes from the baseline of the PSQI scores (95% confidence interval) of quetiapine vs placebo in GAD.
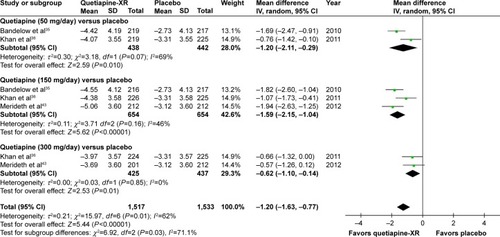
Figure 13 The forest plot of comparison of the mean changes from the baseline of the PSQI scores (95% confidence interval) of quetiapine vs SSRIs in GAD.
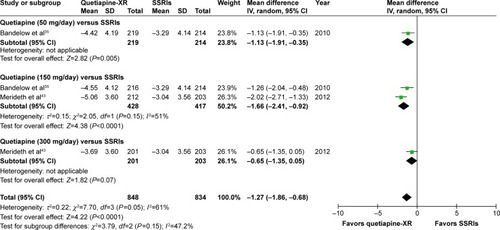
Figure 14 The forest plot of comparison of the mean changes from the baseline of the MADRS scores (95% confidence interval) of quetiapine vs placebo in GAD.
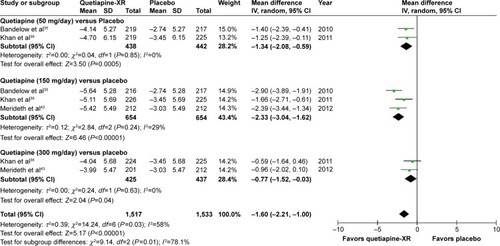
Figure 15 The forest plot of comparison of the mean changes from the baseline of the MADRS scores (95% confidence interval) of quetiapine vs SSRIs in GAD.
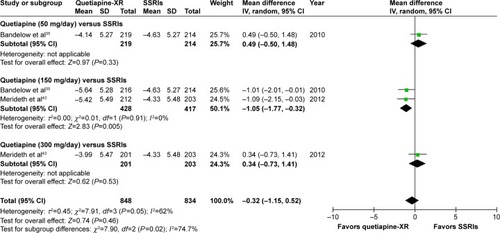
Figure 16 The forest plot of comparison of relative risks (95% confidence interval) for the overall discontinuation rate of quetiapine vs placebo in GAD.
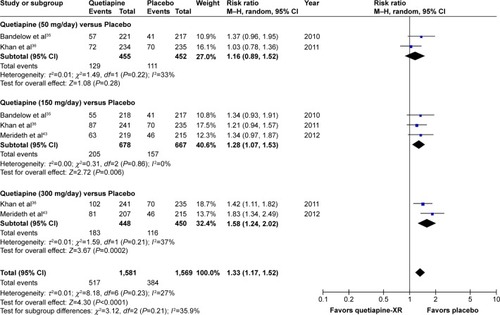
Figure 17 The forest plot of comparison of relative risks (95% confidence interval) for the overall discontinuation rate of quetiapine vs SSRIs in GAD.
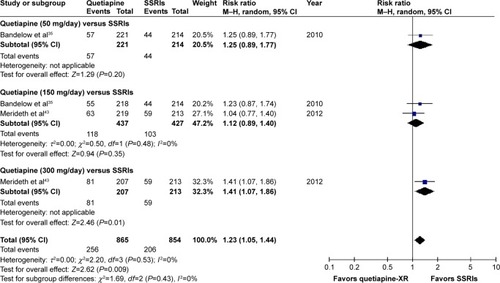
Figure 18 The forest plot of comparison of relative risks (95% confidence interval) for the discontinuation rate due to adverse events of quetiapine vs placebo in GAD.
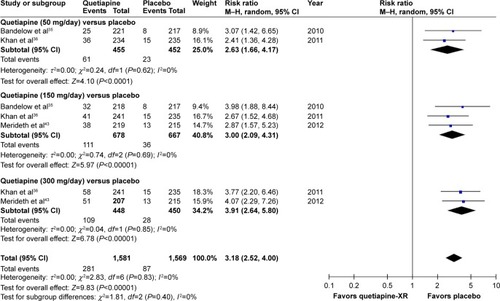
Figure 19 The forest plot of comparison of relative risks (95% confidence interval) for the discontinuation rate due to adverse events of quetiapine vs SSRIs in GAD.