Figures & data
Figure 1 (A) SEM image and (B) HRTEM image of BCc1.
Abbreviations: SEM, scanning electron microscopy; HRTEM, high-resolution transmission electron microscopy.
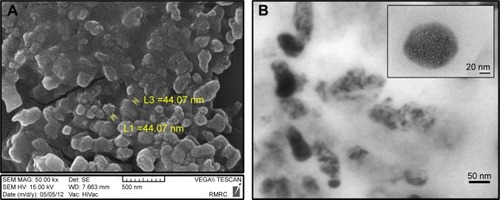
Figure 2 Infrared spectrum analysis (A) and complexometric titration (B)
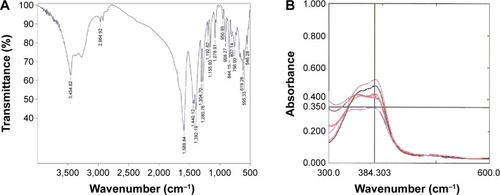
Table 1 IC50 values in neoplastic and normal cells
Figure 3 BCc1 cell toxicity in malignant and normal cells after 24 hours (A) and 48 hours (B).
Abbreviation: MEFs, mice embryonic fibroblasts.
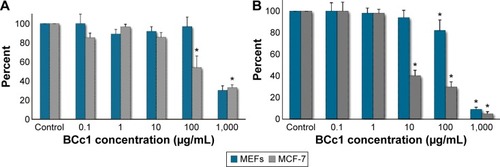
Figure 4 The protection of MEF cells from H2O2-induced oxidative toxicity by BCc1.
Abbreviation: MEF, mice embryonic fibroblast.
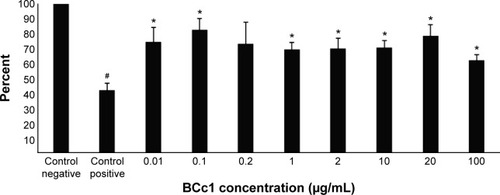
Table 2 BCc1 toxicity report
Figure 5 Expression of cell markers CD44 and CD24 in MCF-7 cell line.
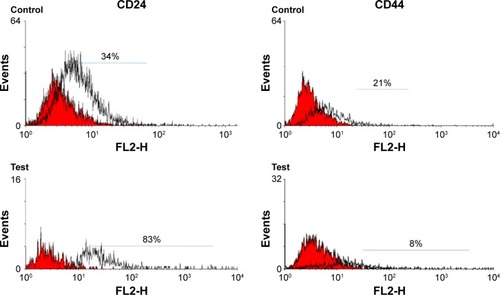
Figure 6 Flow cytometry analysis in the control and test after annexin and PI staining.
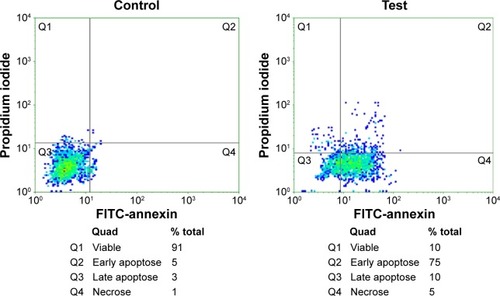
Figure 7 Flow cytometry analysis in the control and test for cell cycle analysis.
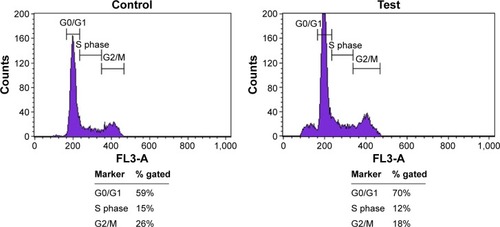
Figure 8 BCc1 tumor suppressing effect (A). Ratio of tumor size on the day 23 in relation to day 1 in the control and test groups (B).
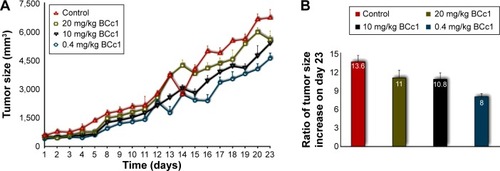
Figure 9 Survival diagrams of the control and test groups.
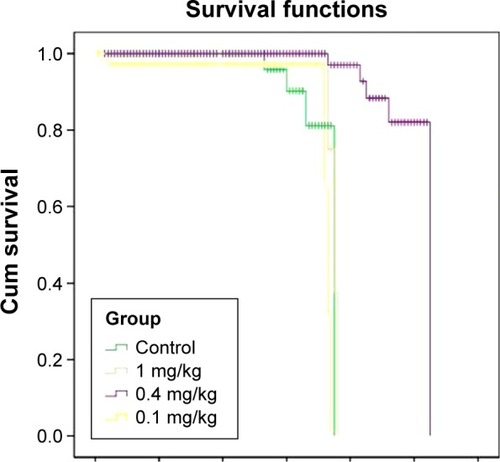
Figure 10 The average amounts for Hb concentration (A), RBC count (B), HCT (C), and MCV (D).
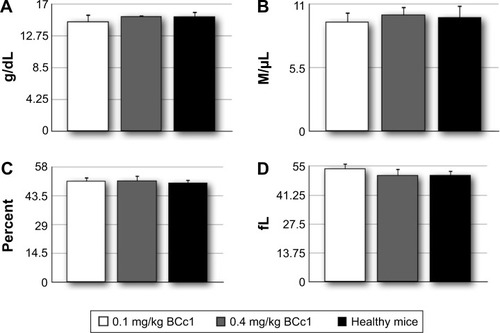
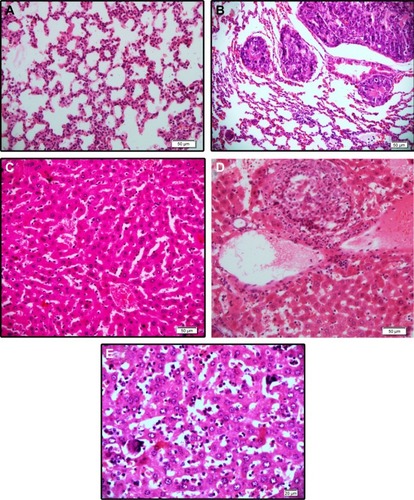
Figure 11 Hematoxylin and eosin staining of (A) normal lung tissue, (B) clumps of metastatic tumor cells, (C) normal liver tissue, (D) clumps of metastatic cells, and (E) the megakaryocyte within the liver sinusoids.