
Figures & data
Figure 1 Effects of calycosin on proliferation, apoptosis, and cell cycle regulation in U87 and U251 cells.
Notes: (A) Cells were treated with various concentrations of calycosin for 24 hours before MTT assay. (B and C) Cells were treated with the indicated concentrations of calycosin (0, 200, 400, and 800 μM) for 24 hours and stained with Annexin V-FITC/PI. At least 10,000 cells were tested per sample. All tests were performed in triplicate and presented as mean ± standard deviation. *P<0.05, **P<0.01, compared with control (0 μM). (D) Cells were exposed to different concentrations of calycosin for 24 hours. After treatment, cells were harvested and subjected to flow cytometric analysis to assess the cell cycle distribution. At least 10,000 cells were analyzed per sample. After treatment, cells were harvested and subjected to flow cytometric analysis to assess the cell cycle distribution. At least 10,000 cells were analyzed per sample.
Abbreviations: OD, optical density; PI, propidium iodide.
Abbreviations: OD, optical density; PI, propidium iodide.
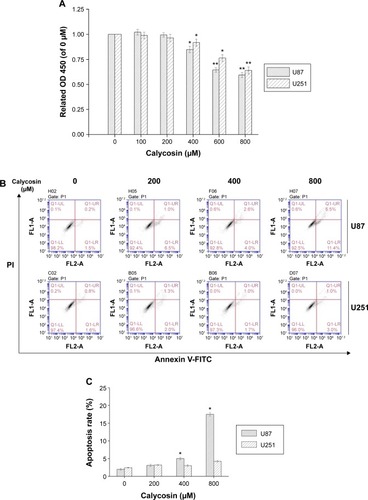
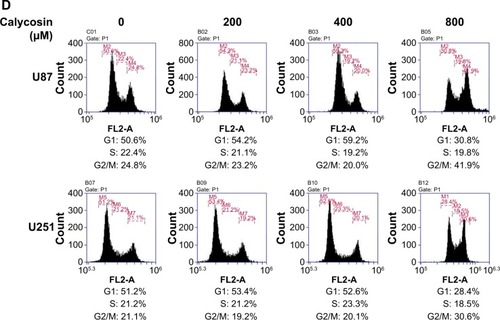
Figure 2 Inhibitory effects of calycosin on cell migration and invasion.
Notes: (A) Cells were treated with indicated concentrations of calycosin for 18 hours. The representative images of migrate cells at the bottom of the membrane stained with crystal violet were visualized. (B) The stained cells were eluted by 33% glacial acetic acid for 20 minutes. The elution was measured at 570 nm to obtain the OD 570 values, and normalized to that of control. (C) Cells were incubated with indicated concentrations of calycosin for 24 hours. Photographs are of the cell invasion through the polycarbonate membrane stained by crystal violet. (D) Each treatment had three replicates. All tests were performed in triplicate and presented as mean ± standard deviation. *P<0.05, compared with control (0 μM).
Abbreviation: OD, optical density.
Abbreviation: OD, optical density.
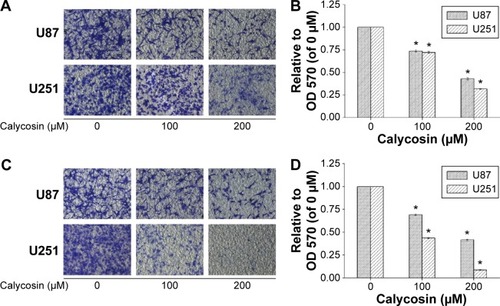
Figure 3 Calycosin inhibited mesenchymal properties and MMPs in U87 and U251 cells.
Notes: (A and B) Dose–response study of calycosin on mesenchymal activator/related genes expression and protein levels in glioblastoma cells. (C and D) Gene expression and protein levels of MMP-2 and MMP-9 in U87 and U251 were evaluated in calycosin treated cells after 24 hours. All tests were performed in triplicate and presented as mean ± standard deviation. *P<0.05, **P<0.01, ***P<0.001, compared with control (0 μM).
Abbreviation: MMP, matrix metalloproteinase.
Abbreviation: MMP, matrix metalloproteinase.
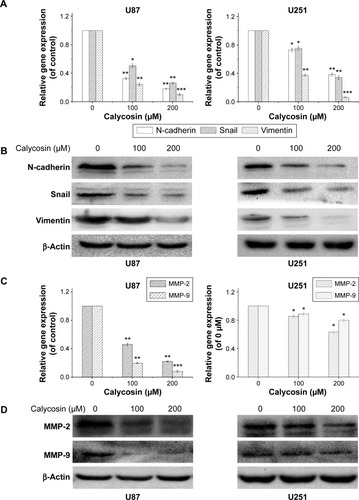
Figure 4 Effects of calycosin on transforming growth factor beta (TGF-β) expression in glioblastoma cells.
Notes: (A and B) Cells were treated with indicated concentrations of calycosin for 24 hours. Gene expression and protein levels of TGF-β were evaluated by real-time PCR and Western blot, respectively. *P<0.05, compared with control (0 μM).
Abbreviation: PCR, polymerase chain reaction.
Abbreviation: PCR, polymerase chain reaction.
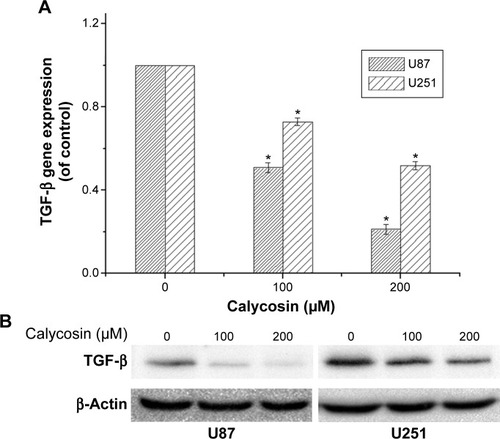
Figure 5 Overexpression of transforming growth factor beta (TGF-β) reduced response to calycosin.
Notes: U87 were transfected with TGF-β1 expression plasmid or empty vector with or without calycosin. (A and B) Twenty-four hours after the transfection, cells were treated with 200 μM calycosin or vehicle for another 18 hours. The representative images of migrate cells at the bottom of the membrane stained with crystal violet were visualized; the stained cells were eluted by 33% glacial acetic acid for 20 minutes. Relative OD 570 was obtained and normalized to that of group a. (C and D) Transfected cells were incubated with calycosin for 24 hours. Photographs of the cell invasion through the polycarbonate membrane stained by crystal violet, relative OD 570 were obtained and normalized to that of group a. (E) Overexpression of TGF-β restored the protein level of itself and downstream molecules. Twenty-four hours after transfection, cells were incubated with calycosin or vehicle for another 24 hours. Cell extracts from each group were immunoblotted for TGF-β, N-cadherin, Snail, Vimentin, MMP-2, and MMP-9, respectively. *P<0.05, compared with group a. **P<0.05 compared with group b. The data are representative of three independent experiments and are presented as the mean ± standard deviation. + Means plasmid transfected or calycosin was added; − means plasmid was not transfected or calycosin was not added (vehicle was added).
Abbreviations: MMP, matrix metalloproteinase; OD, optical density.
Abbreviations: MMP, matrix metalloproteinase; OD, optical density.
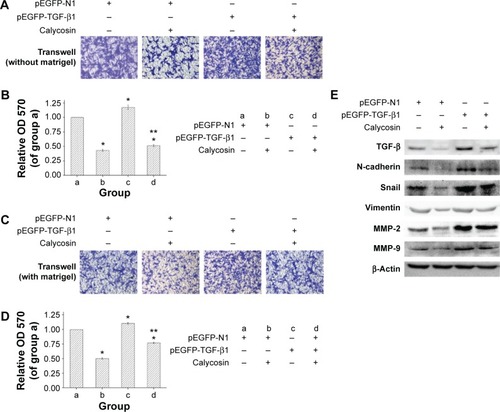
Figure 6 In vivo antitumor effects of calycosin in a xenograft model.
Notes: Mice with U87 xenografts were injected every other day with 7.5 mg/kg calycosin or PBS. (A) Representative photographs of the gross U87 tumors from nude mice treated with calycosin or PBS. (B and C) The tumor volume and body weight were measured two to three times per week. (D) At the end of the experiment, tumor tissues were excised from mice, and the protein lysates (40 μg per lane) extracted from the tumor tissues were assessed by immunoblotting for TGF-β, N-cadherin, Snail, Vimentin, MMP-2, MMP-9, and β-actin, respectively. *P<0.05 compared with the PBS group.
Abbreviations: CA, calycosin; MMP, matrix metalloproteinase; PBS, phosphate-buffered saline.
Abbreviations: CA, calycosin; MMP, matrix metalloproteinase; PBS, phosphate-buffered saline.
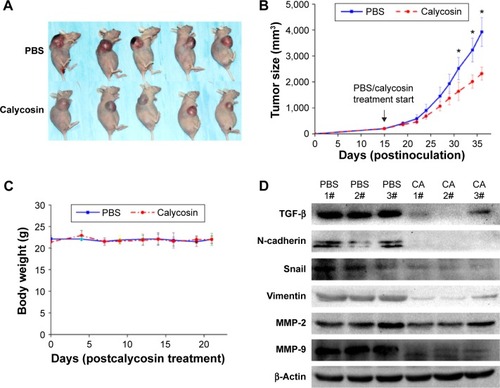
Table S1 Primers for quantitative real-time RT-PCR analysis of gene transcript expression