Figures & data
Table 1 Primers used in the construction of IFN-λ analogs and qPCR assays
Figure 1 Design of IFN-λ analogs.
Notes: (A) Alignment of amino acid sequences of IFN-λ1 (IL-29S) and IFN-λ3: conserved amino acids were labeled in red, and the helices A–F were marked underneath the sequence, while the arbitrarily divided fragments a, b, c, and d were labeled above the sequence. (B) Sequence structure of the nine analogs: IFN-λ1 fragments were labeled in red and IFN-λ3 fragments in blue.
Abbreviation: IFN, interferon.
Abbreviation: IFN, interferon.
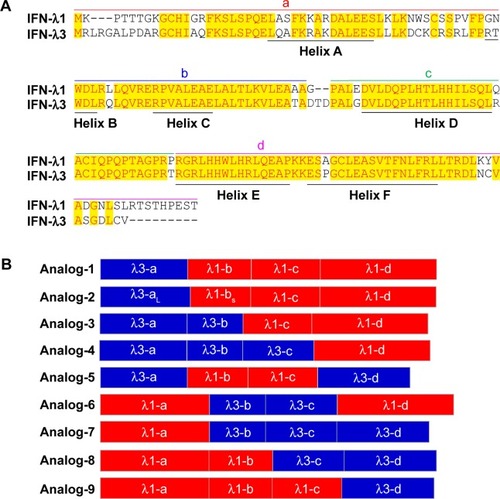
Figure 2 Analysis and characterization of expressed proteins.
Notes: (A) SDS-PAGE gel analysis of small-scale expression of the nine designed analogs: the arrow on the right marks the position of the expected protein band; M: protein marker; A: IPTG-induced; B: uninduced. (B) Representative chromatographs of analog-6 (left) and PEG-analog-6 (right) eluted from the SP HP column. (C) SDS-PAGE gel analysis of purified proteins (left) and purified PEGylated proteins (right): the samples were undenatured and run in nonreducing conditions. (D) HPLC analysis of purified IFN-λ1 (IL-29S) (left) and analog-6 (right): the peak on the left represents the PEGylated protein, and the peak on the right represents the unmodified protein.
Abbreviations: IFN, interferon; IPTG, isopropyl-β-D-thiogalactopyranoside; PEG-IFN, pegylated-interferon; SDS-PAGE, polyacrylamide gel electrophoresis.
Abbreviations: IFN, interferon; IPTG, isopropyl-β-D-thiogalactopyranoside; PEG-IFN, pegylated-interferon; SDS-PAGE, polyacrylamide gel electrophoresis.
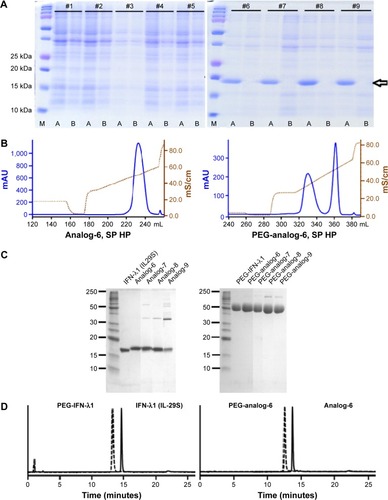
Table 2 Characterization of purified proteins by LC/Q-TOF/MS
Figure 3 Stimulation of antiviral gene expression.
Notes: (A–C) qRT-PCR analysis of MxA and OAS gene expression: cells were treated by different concentrations of proteins for 12 hours, and induction of MxA and OAS expression by analog-6, -7, -8, and -9, and IFN-λ1 showed good dose-dependency (A); cells were treated by 10 ng/mL proteins for 3, 12, and 24 hours, and induction of MxA and OAS expression showed good time-dependency (B); cells were treated by 10 ng/mL PEGylated proteins for 12 hours, and PEG-analog-6 and PEG-analog-7 showed similar inducing activity as PEG-IFN-λ1 and PEG-IFN-α2a (C). (D) Representative image of Western blot analysis of STAT1 phosphorylation: cells were treated by 10 ng/mL PEGylated protein for 12 hours.
Abbreviations: IFN, interferon; PEG-IFN, pegylated-interferon; qRT-PCR, quantitative real-time polymerase chain reaction.
Abbreviations: IFN, interferon; PEG-IFN, pegylated-interferon; qRT-PCR, quantitative real-time polymerase chain reaction.
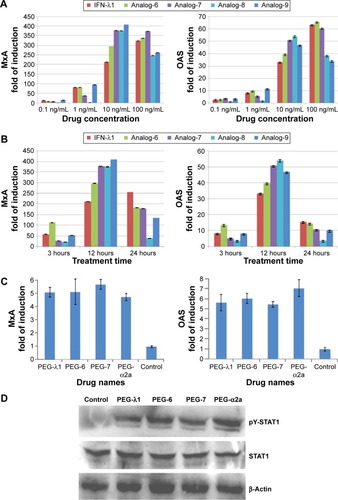
Figure 4 Activation of the ISRE-luciferase reporter.
Notes: (A) Representative response curves of anolog-6, analog-7, and IFN-λ1. (B) Representative response curves of PEG-analog-6, PEG-analog-7, PEG-IFN-λ1, and PEG-IFN-α2a. Data were analyzed using the GraphPad Prism software.
Abbreviations: IFN, interferon; ISRE, IFN-stimulated response element; PEG-IFN, pegylated-interferon.
Abbreviations: IFN, interferon; ISRE, IFN-stimulated response element; PEG-IFN, pegylated-interferon.
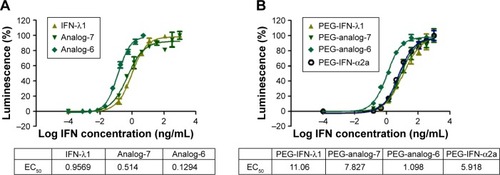
Figure 5 Anti-HCV assay.
Notes: (A) HCVcc-infected Huh-7.5.1 cells were treated by 0, 0.5, 5, and 50 ng/mL of PEG-analog-6, PEG-analog-7, PEG-IFN-λ1, or PEG-IFN-α2a for 48 hours and stained by an anti-HCV core antibody (green, upper panels) and DAPI (blue, lower panels); scale bar: 50 μm. (B) Quantification of HCV positive cells: number of HCV foci in three wells was counted manually, and the average number of HCV foci per well was shown.
Abbreviations: HCV, hepatitis C virus; IFN, interferon; PEG-IFN, pegylated-interferon.
Abbreviations: HCV, hepatitis C virus; IFN, interferon; PEG-IFN, pegylated-interferon.
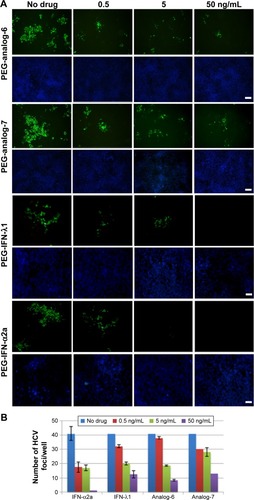
Figure 6 Quantification of anti-HCV and anti-H3N2 potency.
Notes: (A) Representative curves of HCV inhibition: HCVcc-infected Huh-7.5.1 cells were treated by PEG-analog-6, PEG-analog-7, PEG-IFN-λ1, or PEG-IFN-α2a for 48 hours and values representing relative HCV RNA levels were fitted into the GraphPad Prism software to generate the inhibition curves and IC50. (B) Representative curves of H3N2 inhibition: A549 cells were treated by analog-6, analog-7, IFN-λ1, or IFN-α2a for 24 hours and then infected by H3N2 influenza A virus for 90 minutes, and the amount of H3N2 virus was quantified by ELISA 72 hours later.
Abbreviations: HCV, hepatitis C virus; IFN, interferon; ELISA, enzyme-linked immunosorbent assay; IC50, half maximal inhibitory concentration; PEG-IFN, pegylated-interferon.
Abbreviations: HCV, hepatitis C virus; IFN, interferon; ELISA, enzyme-linked immunosorbent assay; IC50, half maximal inhibitory concentration; PEG-IFN, pegylated-interferon.
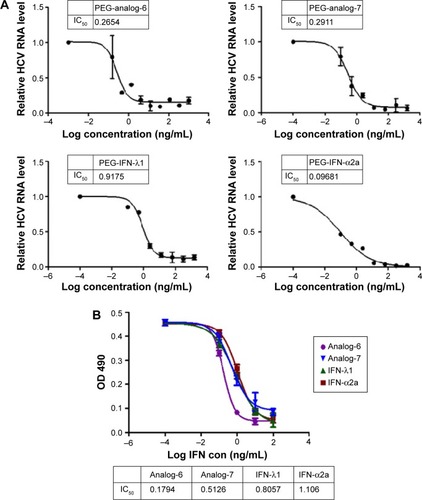
Figure S1 Amino acid sequences of the nine designed analogs.
Note: Interferon (IFN)-λ1 sequence is shown in red and IFN-λ3 sequence in blue.
Figure S2 Stability of analog protein preparations.
Notes: (A) A representative graph of HPLC analysis: an aliquot of PEG-analog-6 (0221) was kept at 40°C for 39 days. (B) Purity of PEG-analog-6 (0221, 0225, 0302) kept at 40°C for up to 39 days. (C) Concentrations of PEG-analog-6 (0221, 0225, 0302) kept at 40°C for up to 39 days.
Abbreviation: HPLC, high-performance liquid chromatography.
Abbreviation: HPLC, high-performance liquid chromatography.
Figure S3 qRT-PCR analysis of MxA and OAS gene expression.
Notes: Cells were treated by 10 ng/mL proteins for 12 hours; MxA and OAS induction activity was significantly reduced after the proteins were treated at 95°C for 5 minutes, and a similarly prepared unrelated protein, human growth hormone, showed no activity.
Abbreviations: IL, interleukin; qRT-PCR, quantitative real-time polymerase chain reaction.
Abbreviations: IL, interleukin; qRT-PCR, quantitative real-time polymerase chain reaction.
Figure S4 MTT assay.
Notes: (A and B) HEK293-ISRE-luciferase cells, (C) Huh-7.5.1 cells: cells were treated by serial dilutions of analog-6, analog-7, or IFN-λ1 (A), or PEG-analog-6, PEG-analog-7, PEG-IFN-λ1, or PEG-IFN-α2a (B and C).
Abbreviations: IFN, interferon; ISRE, IFN-stimulated response element; PEG-IFN, pegylated-interferon.
Abbreviations: IFN, interferon; ISRE, IFN-stimulated response element; PEG-IFN, pegylated-interferon.
Figure S5 qRT-PCR measurement of changes in HCV RNA levels.
Notes: HCVcc-infected Huh-7.5.1 cells were treated by different concentrations of PEG-analog-6, PEG-analog-7, PEG-IFN-λ1, or PEG-IFN-α2a for 48 hours and HCV RNA levels in Huh-7.5.1 cells were measured by qRT-PCR using relative quantification and the 2−ΔΔC(t) method. The results were expressed as fold of changes relative to untreated controls.
Abbreviations: HCV, hepatitis C virus; IFN, interferon; qRT-PCR, quantitative real-time polymerase chain reaction; PEG-IFN, pegylated-interferon.
Abbreviations: HCV, hepatitis C virus; IFN, interferon; qRT-PCR, quantitative real-time polymerase chain reaction; PEG-IFN, pegylated-interferon.