
Figures & data
Figure 1 The XRPD graphs of SM API (A), phospholipids (B), the physical mixture of SM API/phospholipids (C), and SM-PC (D).
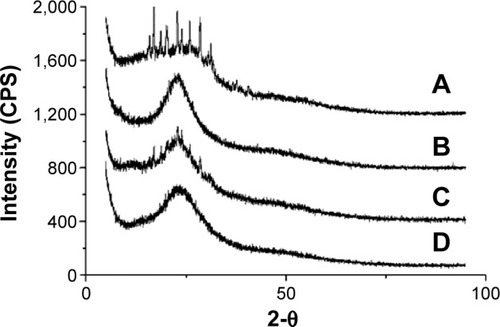
Figure 2 DSC thermograms of SM API (A), phospholipids (B), the physical mixture of SM API/phospholipids (C), and SM-PC (D).
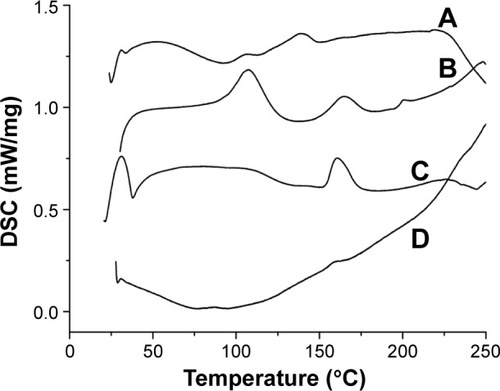
Figure 3 Infrared spectroscopy of SM API (A), phospholipids (B), the physical mixture of SM API/phospholipids (C), and SM-PC (D).
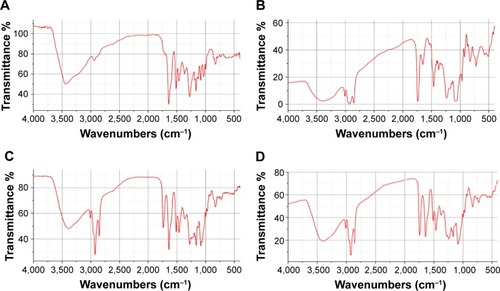
Table 1 Solubility of SM in different mediums
Table 2 The apparent oil–water partition coefficient of SM
Figure 4 Release profiles of three preparations in pH 7.5 phosphate buffer solutions (containing 0.5% SDS).
Abbreviations: SM, silymarin; SM API, SM active pharmaceutical ingredient; SM-PC, SM phytosome complex, TF, taxifolin; SC, silychristin; SD, silydianin; SB, silybin; ISB, isosilybin; SDS, sodium dodecyl sulfate.
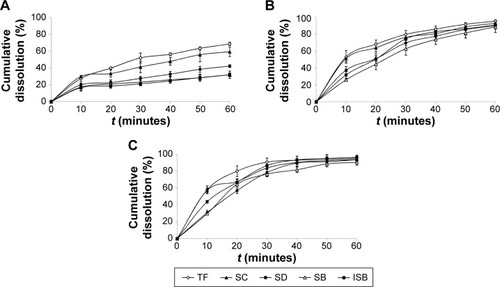
Figure 5 Schematic diagram of drug dissolution of SM MPOP.
Abbreviations: MPOP, microporous osmotic pump; SM MPOP, silymarin MPOP; SM-PC, SM phytosome complex.
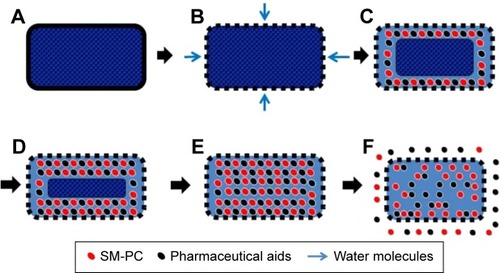
Table 3 Factors and levels of the orthogonal experiment
Table 4 Results of the orthogonal experiment
Table 5 Results of variance analysis
Table 6 f2 values of different batches
Table 7 Curve fitting for drug dissolution of SM MPOP
Table 8 Release profiles of osmotic pressure in different medium
Table 9 f2 values of SM-PC MPOP and SM HPMC tablets in pH 7.5 phosphate buffer solution (contain 0.5% SDS)
Figure 6 Release profiles in pH 7.5 phosphate buffer solution (containing 0.5% SDS).
Abbreviations: SM-PC MPOP, silymarin phytosome complex microporous osmotic pump; SM HPMC, silymarin hydroxypropyl methylcellulose; TF, taxifolin; SC, silychristin; SD, silydianin; SB, silybin; ISB, isosilybin; SDS, sodium dodecyl sulfate.
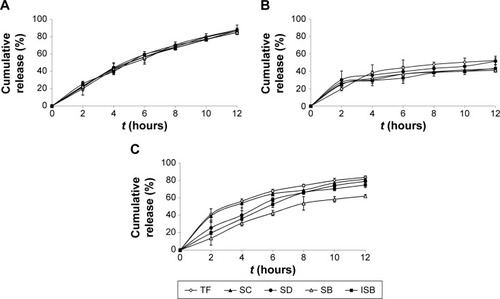
Table S1 Statistical analyses of the release profile among three drugs