Figures & data
Table 1 Composition of both positively and negatively charged liposomal formulations in molar ratio
Table 2 Entrapment efficiency of the prepared neutral and charged liposomal formulations
Table 3 Represents the average size, polydisersity index, and zeta potential of the prepared formulations
Figure 1 Transmission electron photomicrographs of flucytosine, gold-loaded liposomes, and gold nanoparticles according to the prepared formulations.
Abbreviations: F3, PC:Ch:Span 60 at a molar ratio of 1:1:1; F6, PC:Ch:Span 60:SA at a molar ratio of 1:1:1:0.15; F9, PC:Ch:Span 60:DCP at a molar ratio of 1:1:1:0.15; Ch, cholesterol; DCP, dicetyl phosphate; PC, phosphatidylcholine; SA, stearylamine.
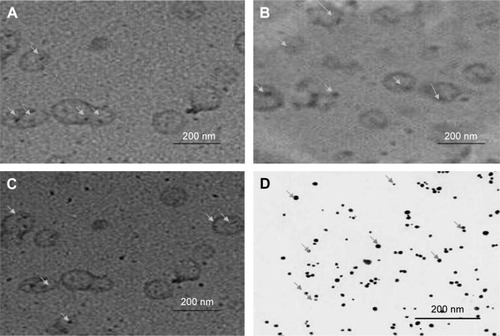
Figure 2 The effect of molar ratio of phosphatidylcholine/cholesterol and Span 60 on the cumulative release profile of flucytosine (A) and gold nanoparticles (B) from the prepared liposomes (F1, F2, and F3) in comparison to the free drug.
Abbreviations: F1, PC:Ch:Span 60 at a molar ratio of 3:1:1; F2, PC:Ch:Span 60 at a molar ratio of 2:1:1; F3, PC:Ch:Span 60 at a molar ratio of 1:1:1; Ch, cholesterol; PC, phosphatidylcholine; SA, stearylamine.
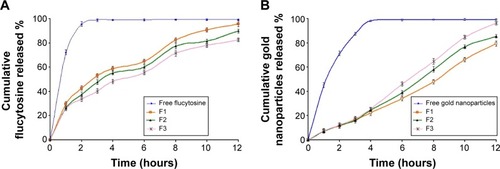
Figure 3 The effect of varying molar ratios of the positive charge inducer (stearylamine) and the negative charge inducer (dicetyl phosphate) on the cumulative release profile of flucytosine (A) and gold nanoparticles (B) from the prepared positive liposomes (F4, F5, and F6) and negative liposomes (F7, F8 and F9) compared with the free drug and the liposomal formulation F3.
Abbreviations: F3, PC:Ch:Span 60 at a molar ratio of 1:1:1; F4, PC:Ch:Span 60:SA at a molar ratio of 1:1:1:0.05; F5, PC:Ch:Span 60:SA at a molar ratio of 1:1:1:0.10; F6, PC:Ch:Span 60:SA at a molar ratio of 1:1:1:0.15; F7, PC:Ch:Span 60:DCP at a molar ratio of 1:1:1:0.05; F8, PC:Ch:Span 60:DCP at a molar ratio of 1:1:1:0.10; F9, PC:Ch:Span 60:DCP at a molar ratio of 1:1:1:0.15; Ch, cholesterol; DCP, dicetyl phosphate; PC, phosphatidylcholine; SA, stearylamine.
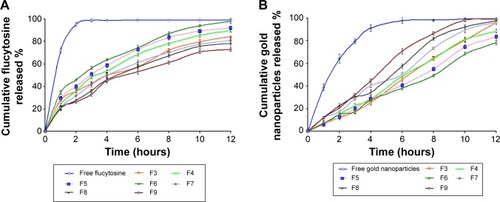
Figure 4 Higuchi plot for the cumulative percentage of flucytosine released versus the square root of time.
Abbreviations: F3, PC:Ch:Span 60 at a molar ratio of 1:1:1; F6, PC:Ch:Span 60:SA at a molar ratio of 1:1:1:0.15; F9, PC:Ch:Span 60:DCP at a molar ratio of 1:1:1:0.15; Ch, cholesterol; DCP, dicetyl phosphate; PC, phosphatidylcholine; SA, stearylamine.
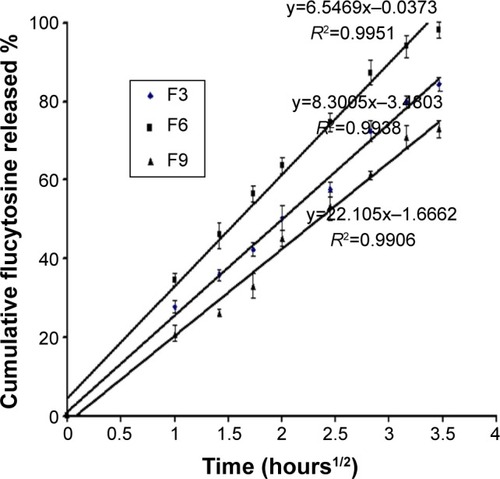
Figure 5 Zero-order plot for the cumulative percentage of gold nanoparticles released versus time.
Abbreviations: F3, PC:Ch:Span 60 at a molar ratio of 1:1:1; F6, PC:Ch:Span 60:SA at a molar ratio of 1:1:1:0.15; F9, PC:Ch:Span 60:DCP at a molar ratio of 1:1:1:0.15; Ch, cholesterol; DCP, dicetyl phosphate; PC, phosphatidylcholine; SA, stearylamine.
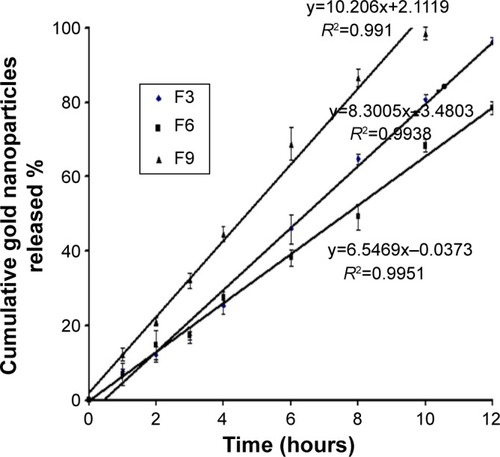
Table 4 Entrapment efficiency of gold nanoparticle flucytosine-loaded liposomes (F3, F6, and F9) after the storage period of 3 months kept at 4°C±1°C, 25°C±1°C, and 37°C±1°C, 60%±5% relative humidity
Table 5 Particle size of the prepared liposomes (F3, F6, and F9) and the released gold nanoparticles after the storage period of 3 months kept at 4°C±1°C, 25°C±1°C, and 37°C±1°C, 60%±5% relative humidity
Table 6 Intraocular penetration distance of colloidal gold nanoparticle solution and neutral, positively, and negatively charged gold nanoliposomes across rabbits’ eyes was measured using computed tomography
Table 7 One-way analysis of variance of ocular penetration of neutral (F3), positively (F6), and negatively (F9) charged gold nanoparticle-loaded liposomes across rabbits’ eyes after 6 hours
Table 8 In vitro susceptibility test of different liposomal formulations and control gold nanoparticle solution by disc diffusion method
Figure 6 The growth inhibition zone on using different formulations of flucytosine and gold nanoparticle-loaded liposomes, flucytosine solution (0.2 µL, 0.8% w/v), and colloidal gold nanoparticle solution (0.2 µL, 150 µM).
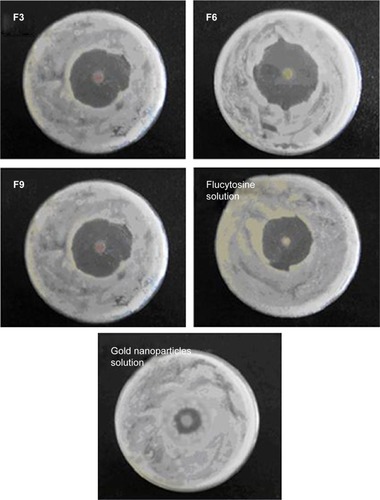
Figure 7 Bio-distribution of gold nanoparticles on instillation of different liposomal formulations (F3, F6, and F9) and Au NPs when computed tomography images of the rabbits’ eyes were captured at different time intervals.
Abbreviations: Au NPs, gold nanoparticles; Con, control solution (isotonic phosphate buffer); Cont neg, nothing is applied; F3, PC:Ch:Span 60 at a molar ratio of 1:1:1; F6, PC:Ch:Span 60:SA at a molar ratio of 1:1:1:0.15; F9, PC:Ch:Span 60:DCP at a molar ratio of 1:1:1:0.15; Ch, cholesterol; DCP, dicetyl phosphate; PC, phosphatidylcholine; SA, stearylamine.
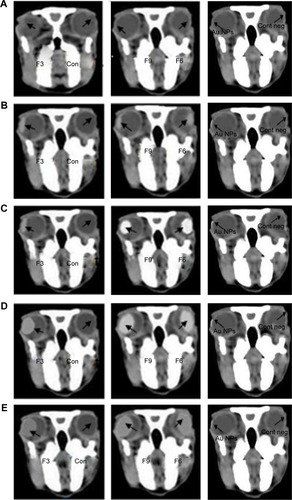
Table 9 Pharmacokinetic parameters of flucytosine in aqueous humor, post-topical instillation of flucytosine solution (0.3% w/v) or flucytosine-loaded liposomal formulations F3, F6, and F9
Figure 8 Concentration time profiles in aqueous humor of rabbits, following topical instillation of flucytosine as solution eye drops or liposomal formulations (F3, F6, and F9).
Abbreviations: F3, PC:Ch:Span 60 at a molar ratio of 1:1:1; F6, PC:Ch:Span 60:SA at a molar ratio of 1:1:1:0.15; F9, PC:Ch:Span 60:DCP at a molar ratio of 1:1:1:0.15; Ch, cholesterol; DCP, dicetyl phosphate; PC, phosphatidylcholine; SA, stearylamine.
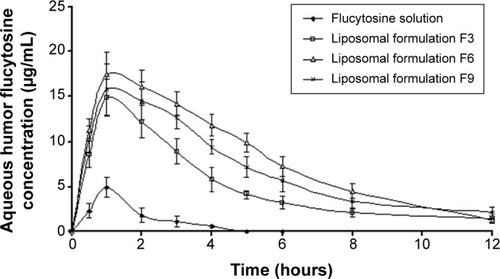
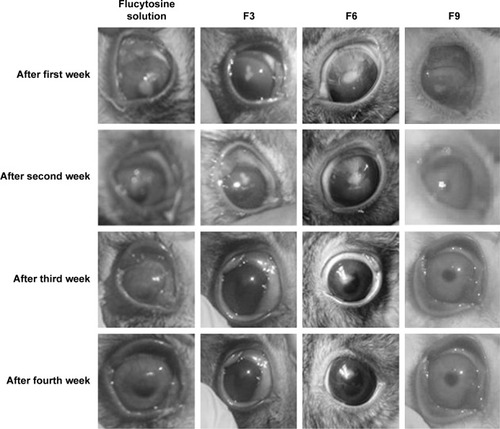
Table 10 The percentage and the time of healing of rabbits’ eyes infected with Candida albicans were measured when nanoliposomes formulations F3, F6, and F9 were applied
Figure 9 Photographs show different stages of the healing and the disappearance of Candida keratitis when infected rabbits’ eyes were treated with flucytosine solution, F3, F6, and F9, respectively.