
Figures & data
Figure 1 Structures, UPLC chromatogram, and the LC/MS profile of OMT and MT.
Abbreviations: OMT, oxymatrine; MT, matrine; UPLC, ultra-performance liquid chromatography; LC/MS, liquid chromatography/mass spectroscopy; HLM, human liver microsomes.
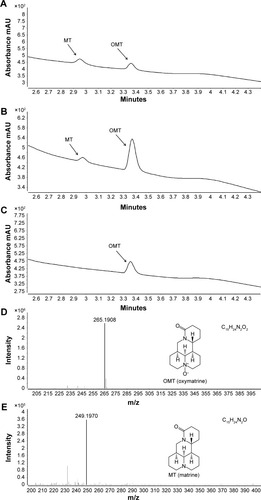
Figure 2 Formation of MT by cDNA-expressed human cytochromes P450 enzymes.
Abbreviations: OMT, oxymatrine; MT, matrine; ANOVA, analysis of variance.
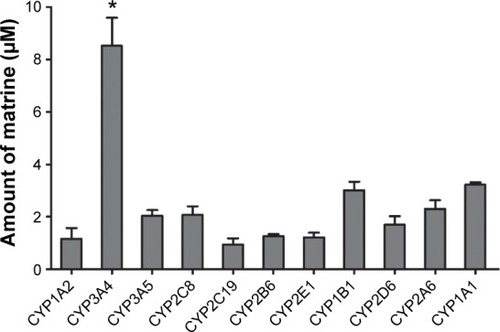
Figure 3 Effects of various chemical inhibitors on the rate of MT formation.
Abbreviations: OMT, oxymatrine; MT, matrine; HLM, human liver microsomes; TES, testosterone; UPLC, ultra-performance liquid chromatography; ANOVA, analysis of variance.
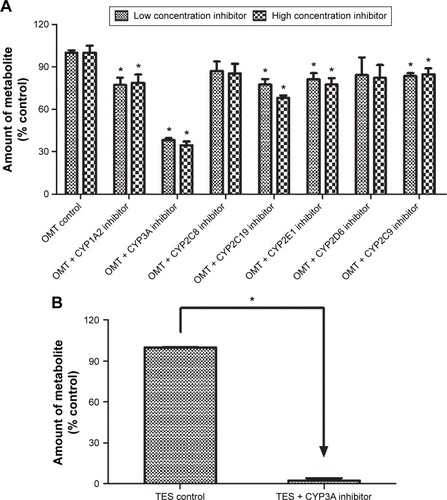
Table 1 Apparent kinetic parameters of metabolism of oxymatrine by pooled HLMs, HIMs, and CYP3A4
Figure 4 Kinetics profiles of OMT metabolism by HLMs (A), HIMs (B), and CYP3A4 (C), respectively.
Abbreviations: OMT, oxymatrine; MT, matrine; HLM, human liver microsomes; HIMs, human intestinal microsomes; V/C, velocity/concentration.
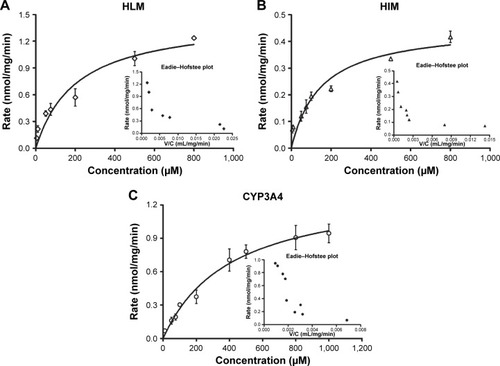
Figure 5 The amount of MT formed in different oxygen contents, the effects of nitrogen on OMT metabolism (A), the effects of helium on OMT metabolism (B), the effects of inactivated enzyme on OMT (50 μM) metabolism (C).
Abbreviations: OMT, oxymatrine; MT, matrine; HLM, human liver microsomes; SD, standard deviation.
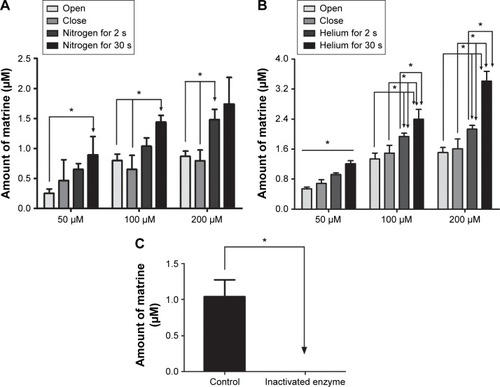
Figure S1 The amount of 6-β-OH-testosterone formed in different oxygen contents, the effects of nitrogen on TES metabolism (A), and the effects of helium on TES metabolism (B).
Abbreviations: HLM, human liver microsomes; TES, testosterone.
Table S1 Intra- and interday precision and accuracy for MT in KPI solution (n=6)
Table S2 Stability of MT in KPI solution at 37°C