Figures & data
Figure 1 Influence of curcumin on cytotoxicity induced by etoposide in HL-60 cells, primary CD34+ cells, and granulocytes.
Abbreviations: CD, cluster of differentiation; CI, combination index; Cur, curcumin; Eto, etoposide.
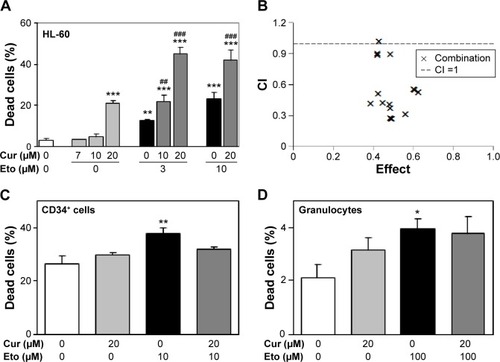
Figure 2 Influence of curcumin on phosphorylation of H2AX and percentage of sub-G1 fraction induced by etoposide.
Abbreviations: CD, cluster of differentiation; Cur, curcumin; Eto, etoposide; PE-A, phycoerythrin-area.
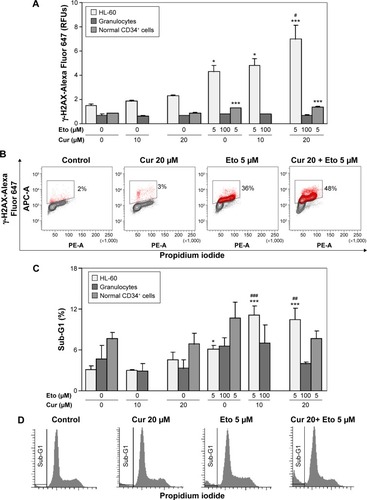
Figure 3 Pro-oxidant activity of curcumin and etoposide in HL-60 cells.
Abbreviations: APC, allophycocyanin; Cur, curcumin; Eto, etoposide; GSH, glutathione; NAC, N-acetyl-l-cysteine; CM-H2DCFDA, 5-(and-6)-chloromethyl-2′,7′-dichlorodihydrofluorescein diacetate; PI, propidium iodide; ROS, reactive oxygen species.
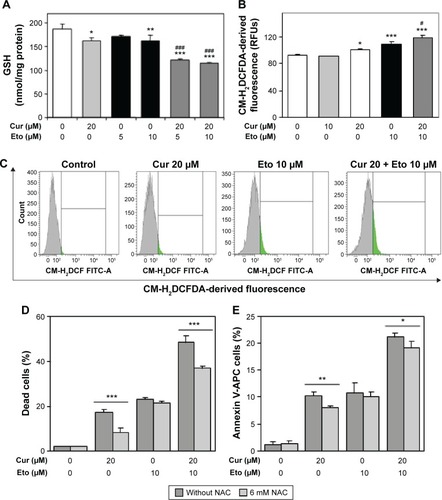
Figure 4 Leukemia progression and effect of etoposide and/or curcumin on body and spleen weights of BNML rats.
Abbreviations: BNML, Brown Norway myeloid leukemia; Cur, curcumin; Eto, etoposide; SEM, standard error of the mean; Cont, control.
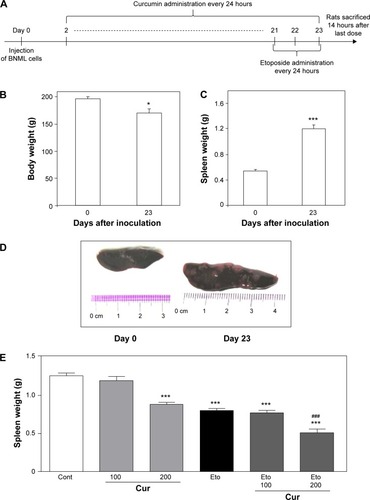
Figure 5 Effect of etoposide and/or curcumin on leukemic cells and healthy B-cells in the spleens of BNML rats.
Abbreviations: 7AAD, 7-amino-actinomycin D; BNML, Brown Norway myeloid leukemic cells; CD, cluster of differentiation; Cont, control; Cur, curcumin; Eto, etoposide; FITC, fluorescein isothiocyanate; GR, granulocytes; lymph, lymphocytes; SEM, standard error of the mean; SSC, side scatter; FSC, forward scatter; RM124-RPE, RM124-R-phycoerythrin.
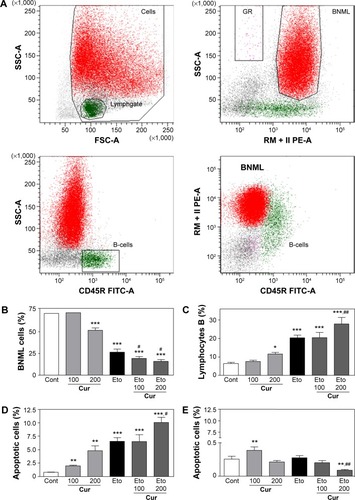
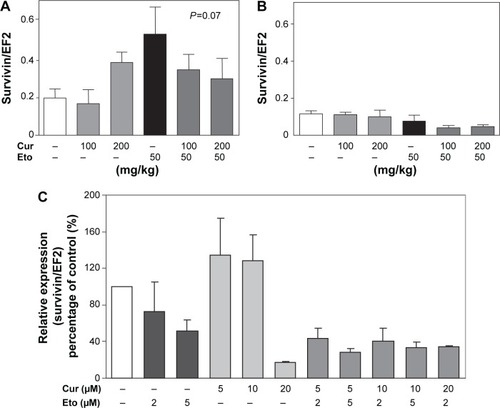
Figure 6 Effect of etoposide and/or curcumin on expression of survivin in leukemic cells and healthy B-cells isolated from the spleens of BNML rats and in HL-60 cells. Notes: BNML rats were treated with curcumin (100 mg/kg or 200 mg/kg) and/or etoposide (50 mg/kg). Spleens were excised on day 23 after inoculation of leukemic cells. HL-60 cells were incubated with different concentrations of curcumin and/or etoposide for 24 hours. (A) Expression of survivin in BNML cells. (B) Expression of survivin in B-cells. (C) Expression of surviving in HL-60 cells by quantitative RT-PCR. EF2 served as a housekeeping gene. Each bar represents mean ± SEM. The analysis of survivin expression was repeated three times.