Figures & data
Figure 1 The morphology of bFGF-PLGA MS (observed by an FEI Quanta 200 scanning electron microscope; FEI, Hillsboro, OR, USA).
Abbreviation: bFGF-PLGA MS, basic fibroblast growth factor – poly(lactic-co-glycolic-acid) microsphere.
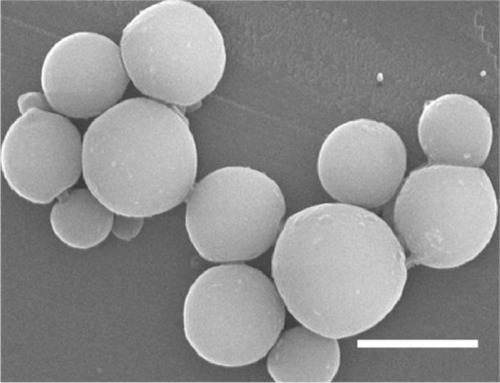
Figure 2 The equipment and experimental process of bFGF-PLGA MS degradation and drug release in static pressure loading experiment.
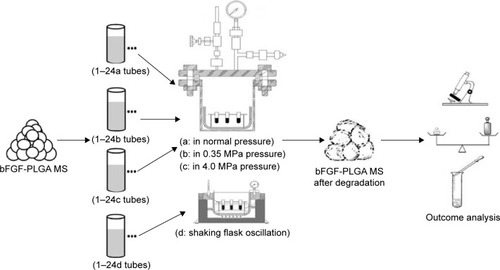
Figure 3 The shearing force load experiment equipment and experimental process of bFGF-PLGA MS degradation and drug release.
Abbreviations: bFGF-PLGA MS, basic fibroblast growth factor – poly(lactic-co-glycolic-acid) microsphere; PBS, phosphate-buffered saline.
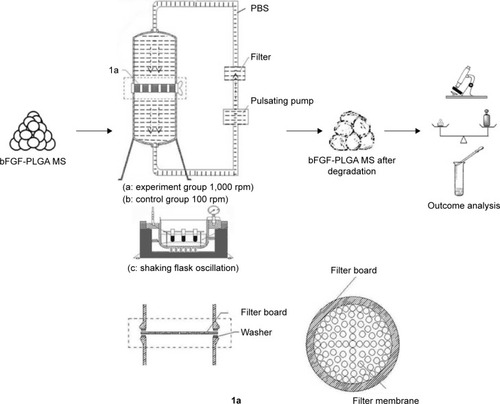
Figure 4 The scanning electron microscope images of bFGF-PLGA MS in shaking flask oscillation group.
Abbreviation: bFGF-PLGA MS, basic fibroblast growth factor – poly(lactic-co-glycolic-acid) microsphere.
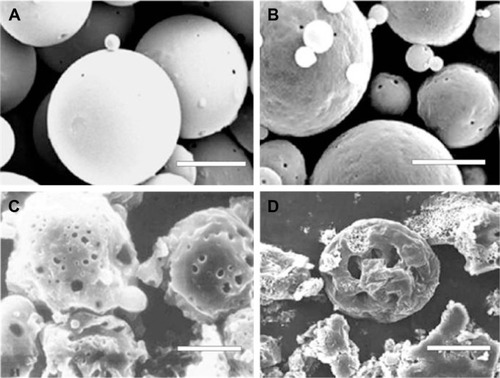
Figure 5 The scanning electron microscope images of bFGF-PLGA MS in 4.0 pressure loading group.
Abbreviation: bFGF-PLGA MS, basic fibroblast growth factor – poly(lactic-co-glycolic-acid) microsphere.
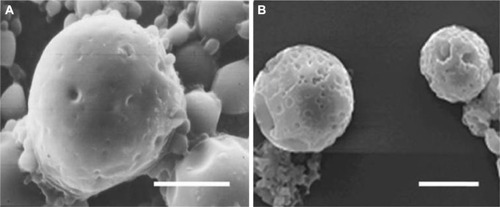
Figure 6 The scanning electron microscope images of bFGF-PLGA MS in shearing force loading experiment group.
Abbreviation: bFGF-PLGA MS, basic fibroblast growth factor – poly(lactic-co-glycolic-acid) microsphere.
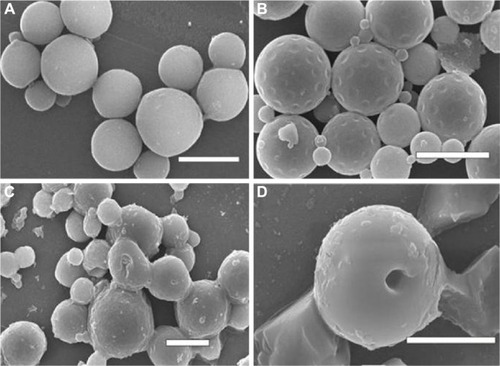
Figure 7 The molecular weight changes of bFGF-PLGA MS during degradation in the static pressure loading experiment.
Abbreviations: bFGF-PLGA MS, basic fibroblast growth factor – poly(lactic-co-glycolic-acid) microsphere; Mw, molecular weight.
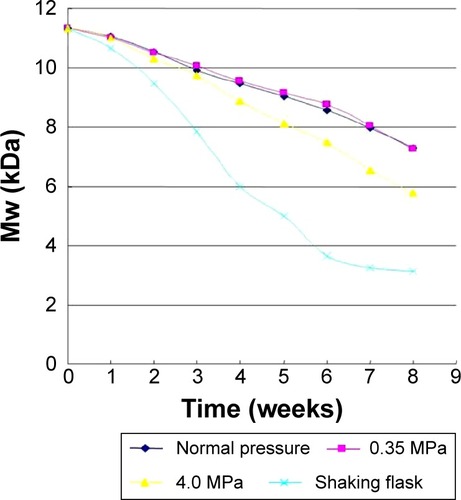
Figure 8 The molecular weight changes of bFGF-PLGA MS during degradation in shearing force loading experiment.
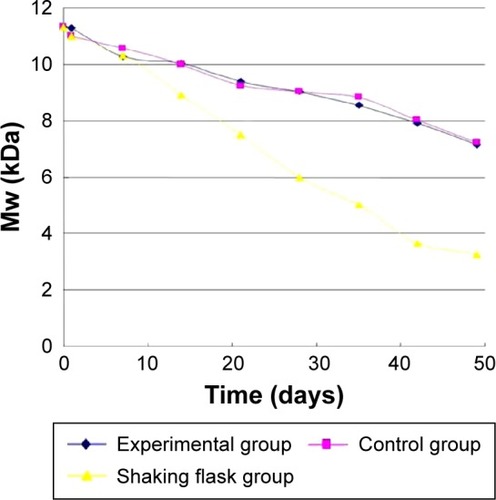
Figure 9 Mass loss of bFGF-PLGA MS during degradation in the static pressure loading experiment.
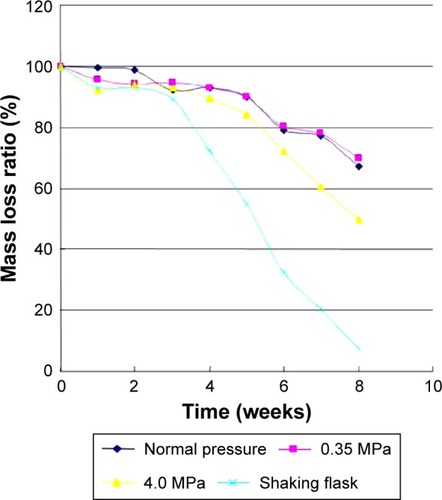
Figure 10 Mass loss of bFGF-PLGA MS during degradation in shearing force loading experiment.
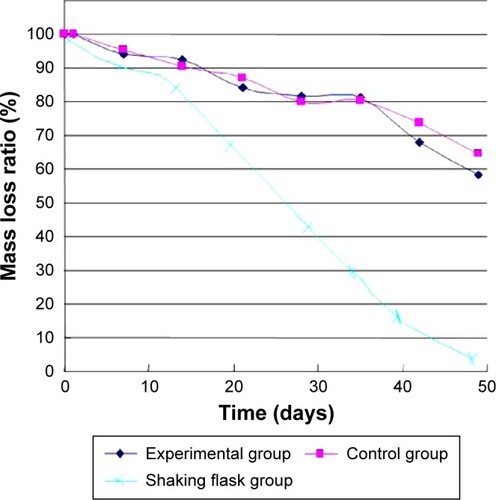
Figure 11 Drug release of bFGF-PLGA MS during degradation in the static pressure loading experiment.
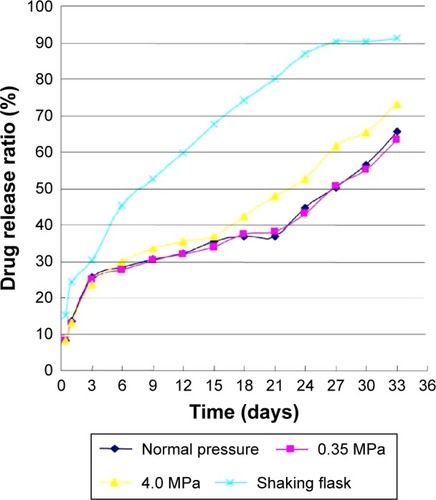
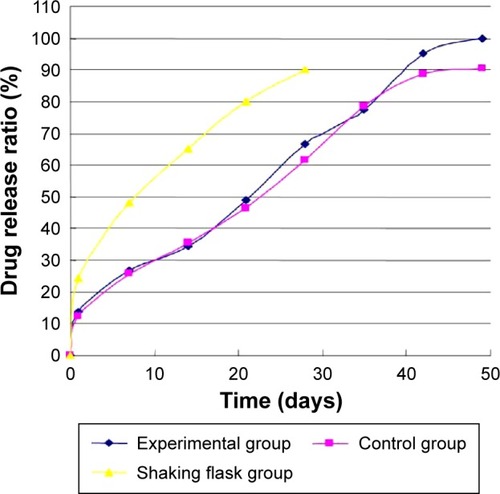
Figure 12 Drug release of bFGF-PLGA MS during degradation in shearing force loading experiment.