Figures & data
Figure 1 Chemical structure of β-asarone.
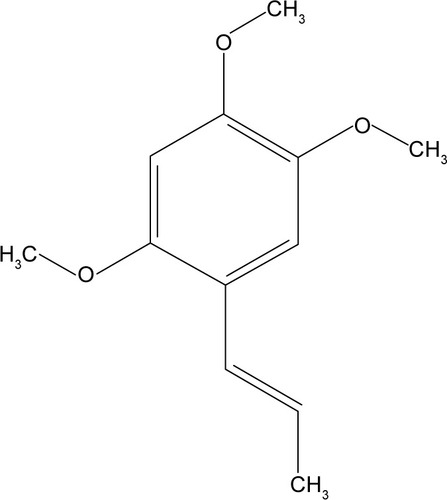
Figure 2 Cognitive performance assessed by the Morris water maze.
Notes: (A) Learning performance was analyzed by monitoring escape latency. Statistical analysis revealed a significant group effect (F=42.191, P=0.000) and significant interaction between factors (group × day) (F=3.151, P=0.000). There were significant differences between MG and PG, LDG, MDG, and HDG (P<0.05, P=0.000, 0.001, 0.000, 0.000, 0.000). The control group had shorter escape latency than the MG, PG, LDG, and MDG (P<0.05, P=0.000), but not the HDG (P>0.05, P=0.217). (B) There were significant differences between the MG and the other groups in the number of times rats passed the hidden platform (P<0.05). (C) Memory retrieval performance was investigated in the probe trial by the time spent in the platform quadrant. The PG and β-asarone groups spent a significantly longer time in the target quadrant than the MG (P<0.05). Data are expressed as mean ± SD; N=8–12 animals/group; *P<0.05 vs the control group; **P<0.05 vs the MG.
Abbreviations: CG, control group; MG, model group; PG, positive control group; LDG, low-dose group; MDG, medium-dose group; HDG, high-dose group; SD, standard deviation.
Abbreviations: CG, control group; MG, model group; PG, positive control group; LDG, low-dose group; MDG, medium-dose group; HDG, high-dose group; SD, standard deviation.
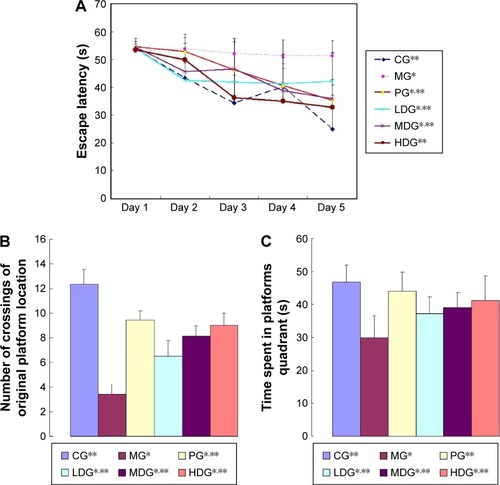
Figure 3 Increased expression of SYP and GluR1 in the hippocampus and cortex of transgenic mice.
Notes: (A) Western blots of SYP and GluR1. (B) Densities of SYP, GluR1 relative to GAPDH. Blots were digitized and the bands quantified using an image analysis system. n=3. Bars show mean ± SD of three independent experiments. *P<0.05 vs control group, **P<0.05 vs MG.
Abbreviations: SYP, synaptophysin; GluR1, glutamatergic receptor 1; SD, standard deviation; MG, model group; CG, control group; PG, positive control group; LDG, low-dose group; MDG, medium-dose group; HDG, high-dose group.
Abbreviations: SYP, synaptophysin; GluR1, glutamatergic receptor 1; SD, standard deviation; MG, model group; CG, control group; PG, positive control group; LDG, low-dose group; MDG, medium-dose group; HDG, high-dose group.
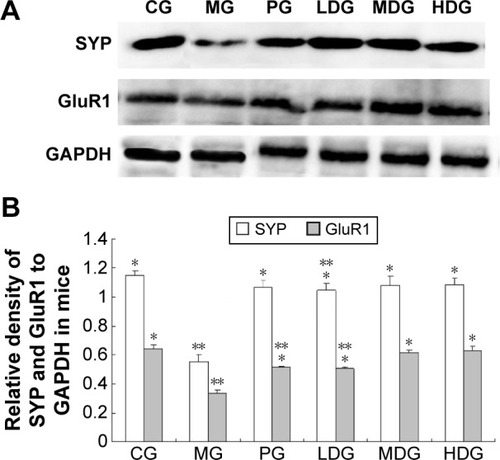
Figure 4 Cell morphology after 24 hours.
Notes: (A) The solvent control group. (B) The model group. (C) 6.25 μmol/L β-asarone. (D) 12.5 μmol/L β-asarone. (E) 25 μmol/L β-asarone. Cells were observed by bright-field microscopy, 40× magnification. The cell’s changes were marked by arrows.
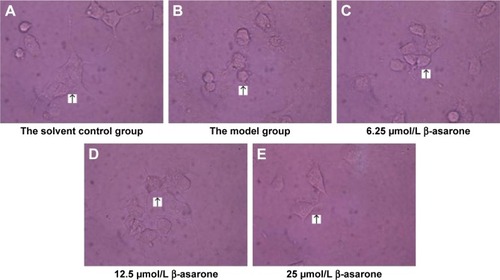
Table 1 Effect of β-asarone with different doses on OD value with NG108-15 cell model induced by Aβ1-42
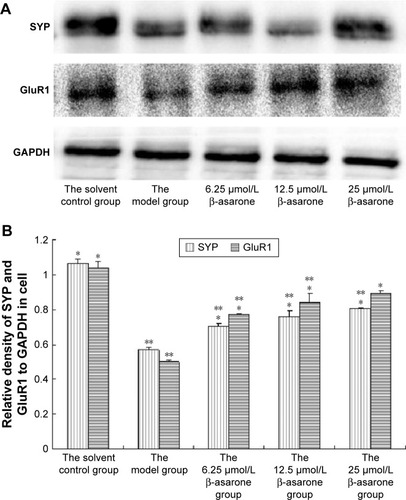
Figure 5 Increased expression of SYP and GluR1 in NG108-15 cells.
Notes: (A) Western blots of SYP and GluR1. (B) Densities of SYP and GluR1 relative to GAPDH. Blots were digitized and the bands quantified using an image analysis system. n=3. Bars show mean ± SD of three independent experiments. *P<0.05 vs control group, **P<0.05 vs model group.
Abbreviations: SYP, synaptophysin; GluR1, glutamatergic receptor 1; SD, standard deviation.
Abbreviations: SYP, synaptophysin; GluR1, glutamatergic receptor 1; SD, standard deviation.