Figures & data
Figure 1 Effects of ANDRO on the production and mRNA levels of TSLP in PMACI-stimulated HMC-1 cells.
Notes: (A) The chemical structure of ANDRO. (B) HMC-1 cells were pretreated with ANDRO (5, 25, 50 μM) or BAPTA-AM (10 μM) for 20 minutes and then stimulated with PMACI. The level of the intracellular calcium was measured every 10 seconds at 440 nm for 500 seconds. Blank, unstimulated cells; PMACI, PMACI-stimulated cells. (C) HMC-1 cells (5×10⁵) were pretreated with ANDRO (5, 25, 50 μM) for 2 hours and then stimulated with PMACI for 7 hours. The production of TSLP was measured with ELISA. (D) HMC-1 (1×10⁶) cells were pretreated with ANDRO (5, 25, 50 μM) for 2 hours and stimulated with PMACI for 5 hours. The transcript level of TSLP was determined with real-time PCR analysis. (E) HMC-1 cells were seeded into 96-well plates at a density of 1×10⁴ cells/well. HMC-1 cells were pretreated with ANDRO for 2 hours and stimulated with PMACI for 8 hours. Cell viability was analyzed with an MTT assay. Data represent the mean ± standard deviation from three independent experiments. #P<0.05, significantly different from unstimulated cells. *P<0.05, significantly different from PMACI-stimulated cells.
Abbreviations: ANDRO, andrographolide; mRNA, messenger RNA; PMACI, phorbol myristate acetate/calcium ionophore A23187; HMC-1, human mast cell line 1; PCR, polymerase chain reaction; ELISA, enzyme-linked immunosorbent assay; TSLP, thymic stromal lymphopoietin; +, chemical is added; −, chemical is absent.
Abbreviations: ANDRO, andrographolide; mRNA, messenger RNA; PMACI, phorbol myristate acetate/calcium ionophore A23187; HMC-1, human mast cell line 1; PCR, polymerase chain reaction; ELISA, enzyme-linked immunosorbent assay; TSLP, thymic stromal lymphopoietin; +, chemical is added; −, chemical is absent.
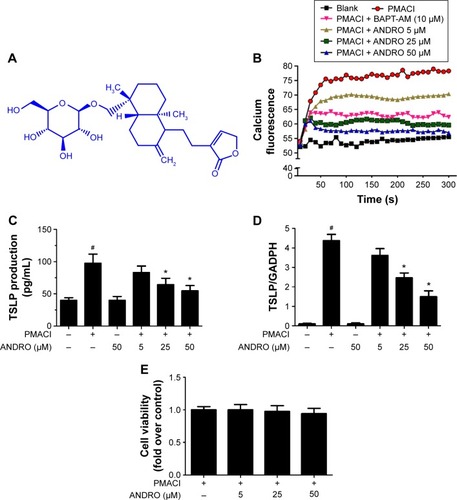
Figure 2 ANDRO inhibited the activation of Rip2/caspase-1/NF-κB in PMACI-stimulated HMC-1 cells.
Notes: (A) HMC-1 cells were pretreated with ANDRO (5, 25, 50 μM) for 2 hours and stimulated with PMACI for 1 hour. Relative protein expression levels of caspase-1 and Rip2 were determined with Western blot analysis (n=3). The relative intensities to GADPH were quantified by densitometry. (B) The caspase-1 activity was determined with a caspase-1 assay kit. (C) HMC-1 cells were pretreated with ANDRO (5, 25, 50 μM) for 2 hours and stimulated with PMACI for 2 hours. Relative protein expression levels of NF-κB and IκB were determined with Western blot analysis (n=3). Data represent the mean ± standard deviation from three independent experiments. #P<0.05, significantly different from unstimulated cells. *P<0.05, significantly different from PMACI-stimulated cells.
Abbreviations: ANDRO, andrographolide; Rip2, Receptor-interacting protein 2; PMACI, phorbol myristate acetate/calcium ionophore A23187; HMC-1, human mast cell line 1; NE, nuclear extract; CE, cytoplasmic extract.
Abbreviations: ANDRO, andrographolide; Rip2, Receptor-interacting protein 2; PMACI, phorbol myristate acetate/calcium ionophore A23187; HMC-1, human mast cell line 1; NE, nuclear extract; CE, cytoplasmic extract.
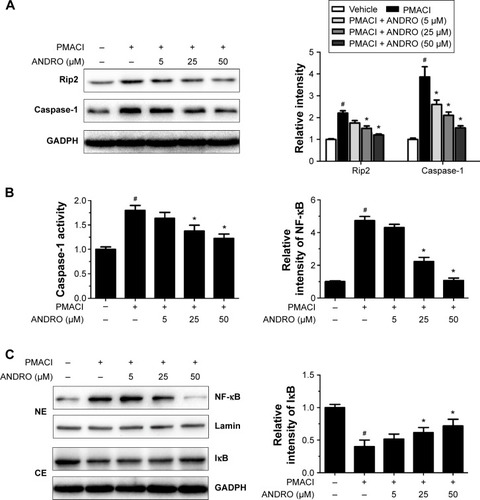
Figure 3 ANDRO suppressed the level of nuclear NF-κB and IL-1β in PMACI-stimulated HMC-1 cells.
Notes: (A) HMC-1 cells pretreated with 50 μM ANDRO for 2 hours were stimulated with PMACI for 20 minutes and processed for immunostaining with anti-p65 antibody. Nuclei of cells were stained with DAPI (blue) and p65 was visualized by green fluorescence. (B) HMC-1 cells (5×10⁵) were pretreated with ANDRO (5, 25, 50 μM) for 2 hours and then stimulated with PMACI for 7 hours. The production of IL-1β was measured with ELISA. (C) HMC-1 (1×10⁶) cells were pretreated with ANDRO (5, 25, 50 μM) for 2 hours and stimulated with PMACI for 5 hours. The transcript level of IL-1β was determined with real-time PCR analysis. Data represent the mean ± standard deviation from three independent experiments. #P<0.05, significantly different from unstimulated cells. *P<0.05, significantly different from PMACI-stimulated cells.
Abbreviations: ANDRO, andrographolide; IL, interleukin; PMACI, phorbol myristate acetate/calcium ionophore A23187; HMC-1, human mast cell line 1; PCR, polymerase chain reaction; DAPI, 4′,6-diamidino-2-phenylindole; ELISA, enzyme-linked immunosorbent assay.
Abbreviations: ANDRO, andrographolide; IL, interleukin; PMACI, phorbol myristate acetate/calcium ionophore A23187; HMC-1, human mast cell line 1; PCR, polymerase chain reaction; DAPI, 4′,6-diamidino-2-phenylindole; ELISA, enzyme-linked immunosorbent assay.
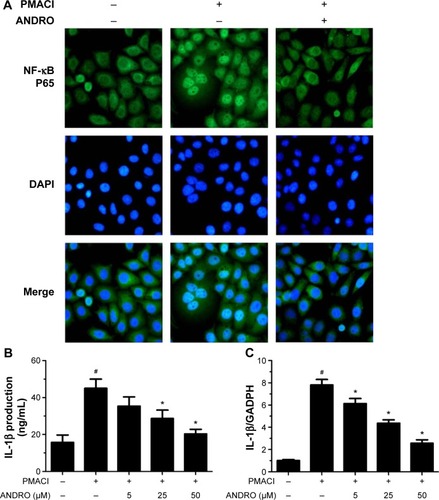
Figure 4 ANDRO improved the clinical symptoms in DNFB-induced AD mice via oral administration.
Notes: ANDRO (50 mg/kg) was orally administered to DNFB-challenged mice. The clinical features were observed 4 hours after the last DNFB challenge. (A) Histological analysis of lesional skin was examined by H&E staining and toluidine blue staining. E indicates the epidermis. Representative photomicrographs were examined at ×200 magnification. (B) The number of scratching behavior of the mice was measured 4 hours after the last DNFB challenge for 10 minutes. The epidermis thickness (C) and the number of mast cells (D) were examined by H&E staining or toluidine blue staining. E indicates the epidermis. (E) The mRNA level of TSLP in lesional skin from DNFB-challenged AD mice was analyzed with real-time PCR. (F) The protein expression level of TSLP from the skin lesion homogenate was analyzed with ELISA. Data represent the mean ± standard deviation from three independent experiments. #P<0.05, significantly different from vehicle group. *P<0.05, significantly different from control group (DNFB-challenged), n=6.
Abbreviations: ANDRO, andrographolide; DNFB, 2,4-dinitrofluorobenzene; H&E, hematoxylin and eosin; mRNA, messenger RNA; TSLP, thymic stromal lymphopoietin; AD, atopic dermatitis; PCR, polymerase chain reaction; ELISA, enzyme-linked immunosorbent assay.
Abbreviations: ANDRO, andrographolide; DNFB, 2,4-dinitrofluorobenzene; H&E, hematoxylin and eosin; mRNA, messenger RNA; TSLP, thymic stromal lymphopoietin; AD, atopic dermatitis; PCR, polymerase chain reaction; ELISA, enzyme-linked immunosorbent assay.
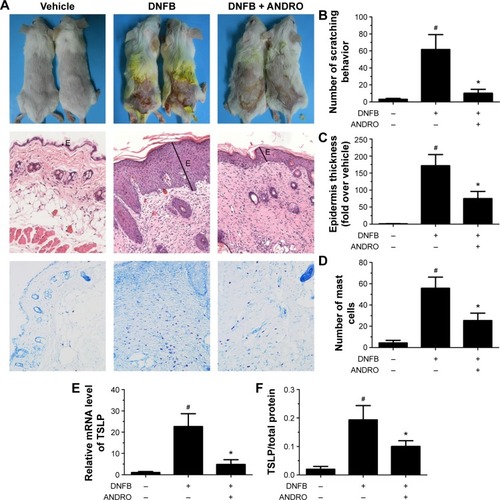
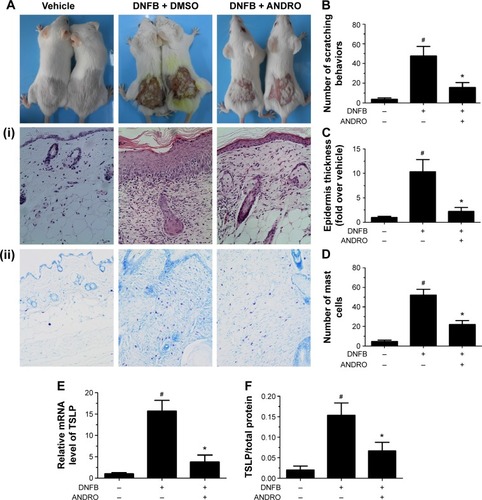
Figure 5 ANDRO improved the clinical symptoms in DNFB-induced AD mice via local administration.
Notes: ANDRO (30 mg/kg) was locally administered to DNFB-challenged mice. The clinical features were observed 4 hours after the last DNFB challenge. (A) Histological analysis of lesional skin was examined by H&E staining (i) and toluidine blue staining (ii). Representative photomicrographs were examined at ×200 magnification. (B) The number of scratching behavior of the mice was measured 4 hours after the last DNFB challenge for 10 minutes. The epidermis thickness (C) and the number of mast cells (D) were examined by H&E staining or toluidine blue staining. (E) The mRNA level of TSLP in lesional skin from DNFB-challenged AD mice was analyzed with real-time PCR. (F) The protein expression level of TSLP from the skin lesion homogenate was analyzed with ELISA. Data represent the mean ± standard deviation from three independent experiments. #P<0.05, significantly different from vehicle group. *P<0.05, significantly different from control group (DNFB-challenged), n=6.
Abbreviations: ANDRO, andrographolide; DMSO, Dimethyl sulfoxide; DNFB, 2,4-dinitrofluorobenzene; H&E, hematoxylin and eosin; mRNA, messenger RNA; TSLP, thymic stromal lymphopoietin; AD, atopic dermatitis; PCR, polymerase chain reaction; ELISA, enzyme-linked immunosorbent assay.
Abbreviations: ANDRO, andrographolide; DMSO, Dimethyl sulfoxide; DNFB, 2,4-dinitrofluorobenzene; H&E, hematoxylin and eosin; mRNA, messenger RNA; TSLP, thymic stromal lymphopoietin; AD, atopic dermatitis; PCR, polymerase chain reaction; ELISA, enzyme-linked immunosorbent assay.