Figures & data
Table 1 Urinary excreted amount of electrolyte, plasma renin activity, plasma aldosterone concentration, and blood pressure during the low sodium diet and high sodium diet periods (n=16)
Table 2 Summary of pharmacokinetic parameters of fimasartan during the low sodium diet and high sodium diet periods (n=16)
Figure 1 Mean plasma concentration–time curves of fimasartan during the low sodium diet and high sodium diet periods.
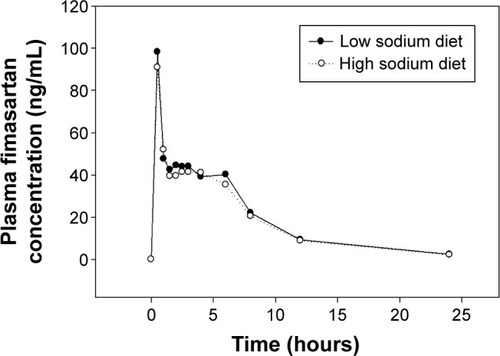
Figure 2 Comparison of individual systemic exposure of fimasartan during the low sodium diet and high sodium diet periods.
Abbreviation: AUC0–24 h, area under the curve from before dose to 24 hours after dose.
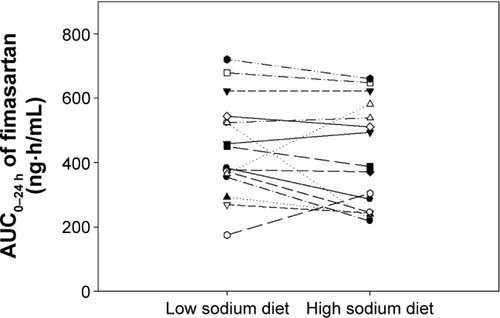
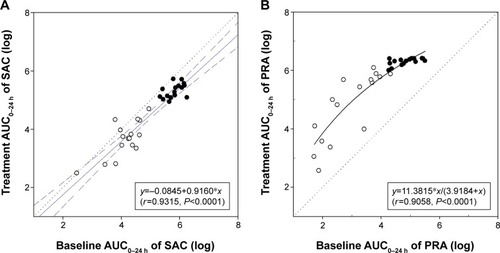
Figure 3 Comparison of baseline area under the curve from before dose to 24 hours after dose (AUC0–24 h) versus treatment AUC0–24 h.
Notes: (A) Comparison of baseline area under the curve from before dose to 24 hours after dose (AUC0–24 h) versus treatment AUC0–24 h of serum aldosterone concentration (SAC). (Closed circle, low sodium diet; open circle, high sodium diet; blue lines, linear regression line and its 95% confidence intervals; and black dot line, line of identity.) (B) Comparison of baseline AUC0–24 h versus treatment AUC0–24 h of plasma renin activity (PRA). (Closed circle, low sodium diet; open circle, high sodium diet; black solid line, hyperbolic regression line; and black dot line, line of identity.)