Figures & data
Figure 1 Observation on the surface of the stent.
Notes: Stent surface under the scanning electron microscope. (A) Bare-metal stent. (B) Processed stent covered with a layer of collagen. Transfection of cells on the stent under confocal laser scanning microscope. (C and D) General morphology of a stent in white balance mode. (E and F) The nuclei of the endothelial cells on a stent were stained blue with DAPI. (G) Some A20-transfected cells are shown in green. (H) No cells are shown in green. Scale bars (C–H) =~500 µm.
Abbreviation: DAPI, 4′,6-diamidino-2-phenylindole.
Abbreviation: DAPI, 4′,6-diamidino-2-phenylindole.
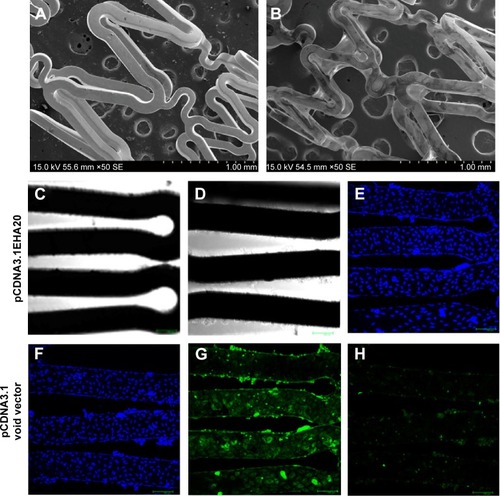
Figure 2 Western blot analysis.
Notes: (A) No E-tag and A20 protein expression are seen in the bare-metal stent group. (B) No E-tag and A20 protein expression are seen in the pCDNA3.1 void vector group. (C) E-tag and A20 protein expression are seen in the pCDNA3.1EHA20 group.
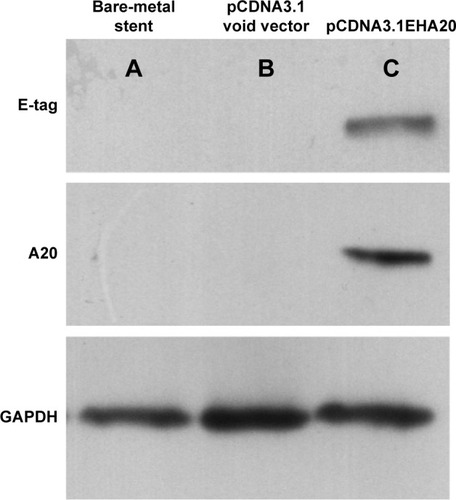
Figure 3 Re-endothelialization of arteries assessed by scanning electron microscopy at 14 days post stent implantation.
Notes: (A) Typical scanning electron microscopy images of the intact stented arterial segments. (B) Percentage of re-endothelialized area of the total stented area. There was significantly higher re-endothelialized area in the pCDNA3.1EHA20 group compared with bare-metal stent group and the pCDNA3.1 void vector group. *P<0.05 vs bare-metal stent group; #P<0.05 vs pCDNA3.1 void vector group.
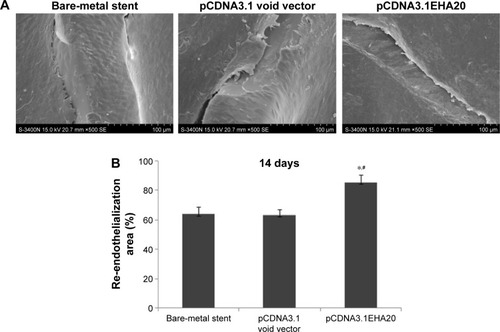
Figure 4 Re-endothelialization of arteries assessed by scanning electron microscopy at 3 months post stent implantation.
Notes: (A) Typical scanning electron microscopy images of the intact stented arterial segments. (B) Percentage of re-endothelialized area of total stented area. There were no differences in the percentage of re-endothelialization among the three groups (P>0.05).
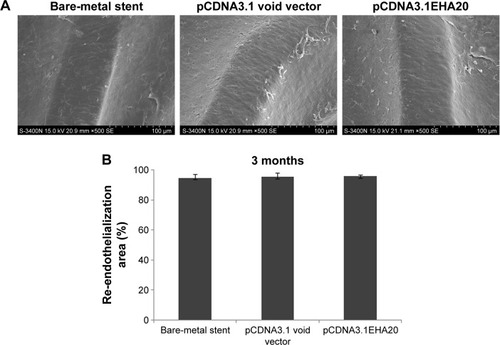
Table 1 Histomorphological measurements at 3 months
Figure 5 Quantification of artery injury and inflammation scores around the stent struts at 14 days and 3 months after stent implantation.
Notes: There was no significant difference in arterial injury score and inflammation score among the three stent groups at 14 days and 3 months (P>0.05).
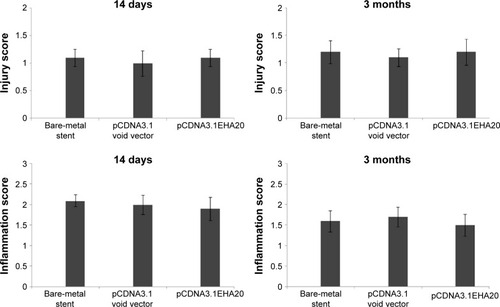
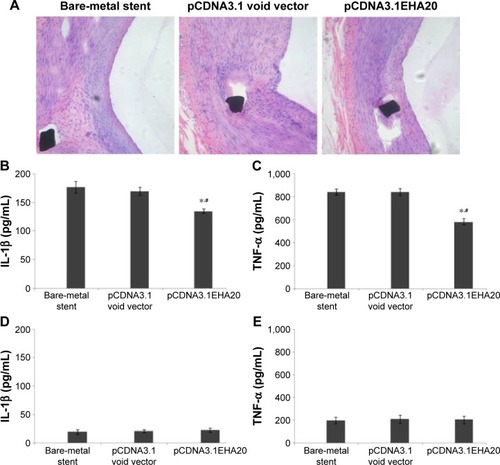
Figure 6 Typical images of stented carotid arteries and expression of inflammatory markers.
Notes: (A) H&E staining (×200) showed obvious intimal hyperplasia in the bare-metal stent group and the pCDNA3.1 void vector group and relatively mild intimal hyperplasia in the pCDNA3.1EHA20 group. (B) Plasma levels of IL-1β after stent implantation with ELISA. (C) Plasma levels of TNF-α after stent implantation with ELISA. (D and E) TNF-α and IL-1β level were not significantly different between the three groups before stent implantation *P<0.05 vs bare-metal stent group; #P<0.05 vs pCDNA3.1 void vector group.
Abbreviations: H&E, hematoxylin and eosin; IL-1β, interleukin-1β; ELISA, enzyme-linked immunosorbent assay; TNF-α, tumor necrosis factor-α.
Abbreviations: H&E, hematoxylin and eosin; IL-1β, interleukin-1β; ELISA, enzyme-linked immunosorbent assay; TNF-α, tumor necrosis factor-α.