
Figures & data
Figure 1 Study flow.
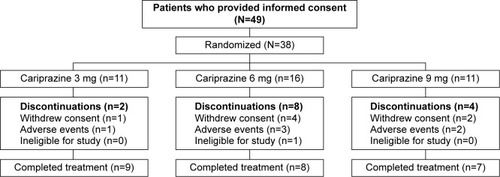
Table 1 Baseline demographics and characteristics (safety population)
Table 2 The ratios of plasma trough concentrations during day 2 – week 10 to the last day of treatment (week 12) (pharmacokinetic analysis population)
Figure 2 Plasma concentrations of cariprazine (A), desmethyl-cariprazine (B), didesmethyl-cariprazine (C) and total active moieties (sum of cariprazine, desmethyl-cariprazine and didesmethyl-cariprazine) (D) for each dose group during the treatment and follow-up periods.
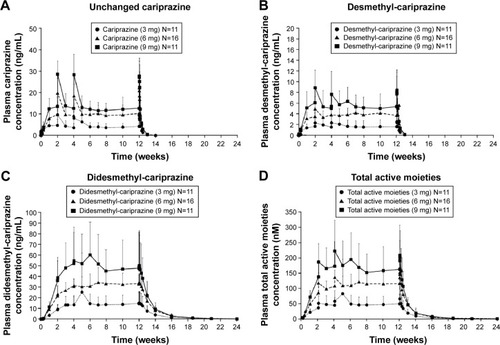
Table 3 Pharmacokinetic parameters measured on the first and last days of the 12-week treatment period (pharmacokinetic analysis population)
Table 4 Summary of adverse events
Table 5 Summary of efficacy assessments (efficacy analysis population)