Figures & data
Figure 1 Method for isolating quercetol from O. sanctum.
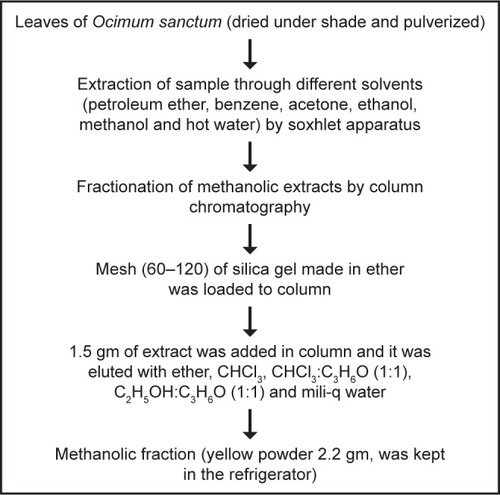
Figure 2 Characterization of isolated compound of Ocimum sanctum (quercetol) by (A) UV spectra, (B) FTIR spectra, (C) (a) NMR spectra, (b) structure of quercetol, and (D) mass spectra.
Abbreviations: FTIR, Fourier transform infrared spectroscopy; NMR, nuclear magnetic resonance; UV, ultra violet; ms, mass spectra.
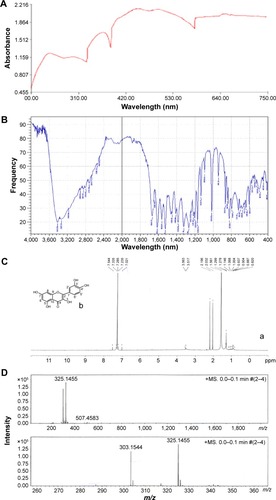
Figure 3 Morphology of HepG2 cells.
Notes: (A) Control, (B) at 300 μg/mL of quercetol, and (C) at 600 μg/mL of quercetol for 24 hours.
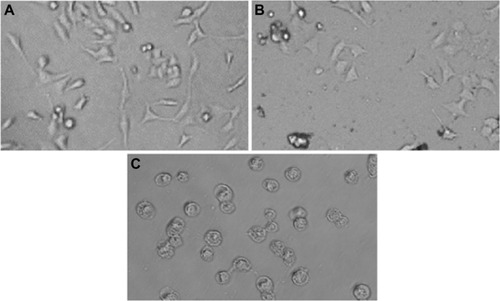
Figure 4 Toxic effect of quercetol in HepG2 cells as determined by (A) MTT and (B) NRU tests.
Notes: Data are expressed as percentage viability of cells exposed to quercetol relative to control cells and mean ± SE of three experiments. *P<0.05 vs control, using one-way ANOVA.
Abbreviations: ANOVA, analysis of variance; MTT, 3-(4,5-dimethylthiazol-2-yl)-2,5-diphenyltetrazolium bromide; NRU, neutral red uptake; SE, standard error.
Abbreviations: ANOVA, analysis of variance; MTT, 3-(4,5-dimethylthiazol-2-yl)-2,5-diphenyltetrazolium bromide; NRU, neutral red uptake; SE, standard error.
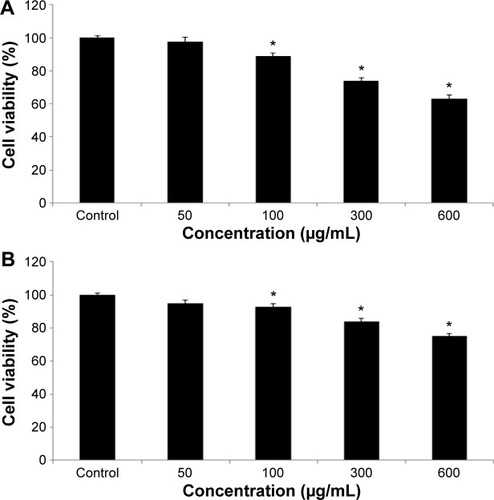
Figure 5 Impact of quercetol on the MMP of HepG2 cells.
Notes: Panel (Ai) shows green fluorescence (JC-1 monomer) only, panel (Aii) shows red fluorescence (JC-1 aggregate) only, and the panel (Aiii) shows merged (green–red fluorescence). (B) % MMP ratio. Data are expressed as the mean ± SE of three experiments. *P<0.05 vs control, using one-way ANOVA.
Abbreviations: ANOVA, analysis of variance; MPP, mitochondrial membrane potential; SE, standard error.
Abbreviations: ANOVA, analysis of variance; MPP, mitochondrial membrane potential; SE, standard error.
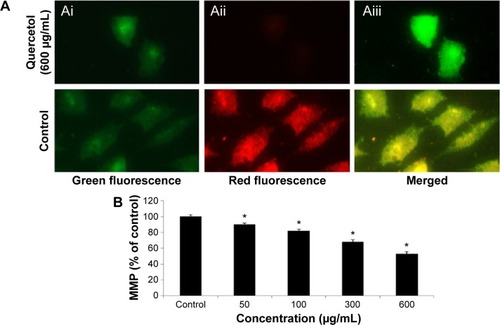
Figure 6 Induction of condensed chromosome and caspase-3 enzyme activity in HepG2 cells after exposure to quercetol.
Notes: (A) Control, (B) at 300 μg/mL of quercetol for 24 hours (arrows indicate condensed chromosome), and (C) Caspase-3 activity. Each value represents the mean ± SE of three experiments. *P<0.05 vs control, using one-way ANOVA.
Abbreviations: ANOVA, analysis of variance; SE, standard error.
Abbreviations: ANOVA, analysis of variance; SE, standard error.
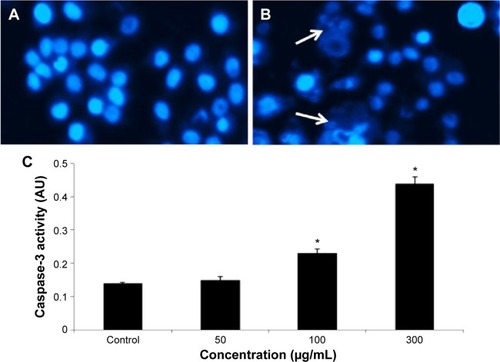
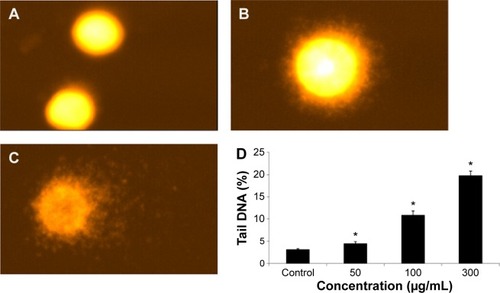
Figure 7 Fragmentation of DNA in HepG2 cells due to 24 hour quercetol exposure.
Notes: (A) Untreated cell, (B) at 100 μg/mL of quercetol, (C) at 300 μg/mL of quercetol, (D) percentage tail DNA. Each value represents the mean ± SE of triplicate tests. *P<0.05 vs control, using one-way ANOVA.
Abbreviations: ANOVA, analysis of variance; SE, standard error.
Abbreviations: ANOVA, analysis of variance; SE, standard error.